Viedoc Reports is the application for viewing and analyzing study progress and performance. Viedoc Reports also allows you to easily browse your data and illustrate it in reports and graphs. The data is collected from your Viedoc study and presented in various plots, with several tools for you to search, filter, and compare data. Viedoc Reports is fully integrated in the Viedoc suite.
Your user role must be configured with permission to access Viedoc Reports. Depending on the visibility conditions for your user role, you may not have access to all data.
To open the application, see Launching Viedoc Reports.
The data in Viedoc Reports is updated as follows:
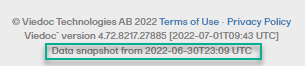
The date and time stamp for the last sync is shown in the footer of the page:
Note! If Viedoc Reports becomes out of sync (due to a failure in the 24h data sync) you can reset and reinitiate the sync job by disabling, wait an hour, and then reenabling Reports in Viedoc Admin/Study settings. Sync will be reset and reinitiated and should display the correct data.
Viedoc Reports is available in the following languages:
Viedoc Reports always uses the latest export version. If a new export version is released, users should check the Release Notes or consult their Viedoc representative to determine if or how their reports or custom reports are affected.
Comment: this text about the data export version exists in overview of Viedoc reports, reports, and creating custom reports lessons.
Viedoc Reports consists of five main pages, selectable in the menu at the top of the landing page:
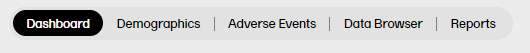
Note! Depending on your user role and permissions, you might not be able to see all of the pages in the menu.
To open settings, select the hamburger menu in the top right-hand corner of the page, and select Settings.
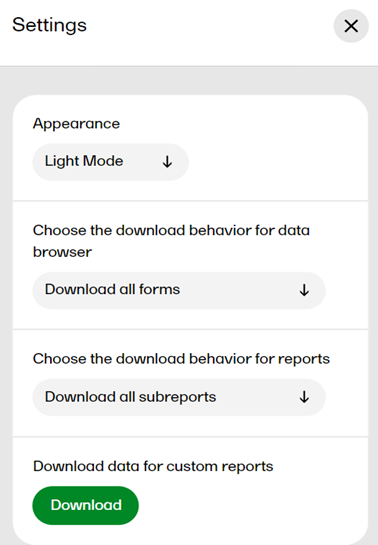
In Settings, you can:
In some scenarios, when a user is assigned a role with permission to Viedoc Reports, the user is met with an error message saying that role visibility is not set. This is due to the data sync that occurs every 24 hours, meaning that the user will be able to access Viedoc Reports when the data sync is complete.
If a plot in Viedoc Reports is indicated as having ”no data”, although data for this variable exist in the study, it can be due to the following reasons:
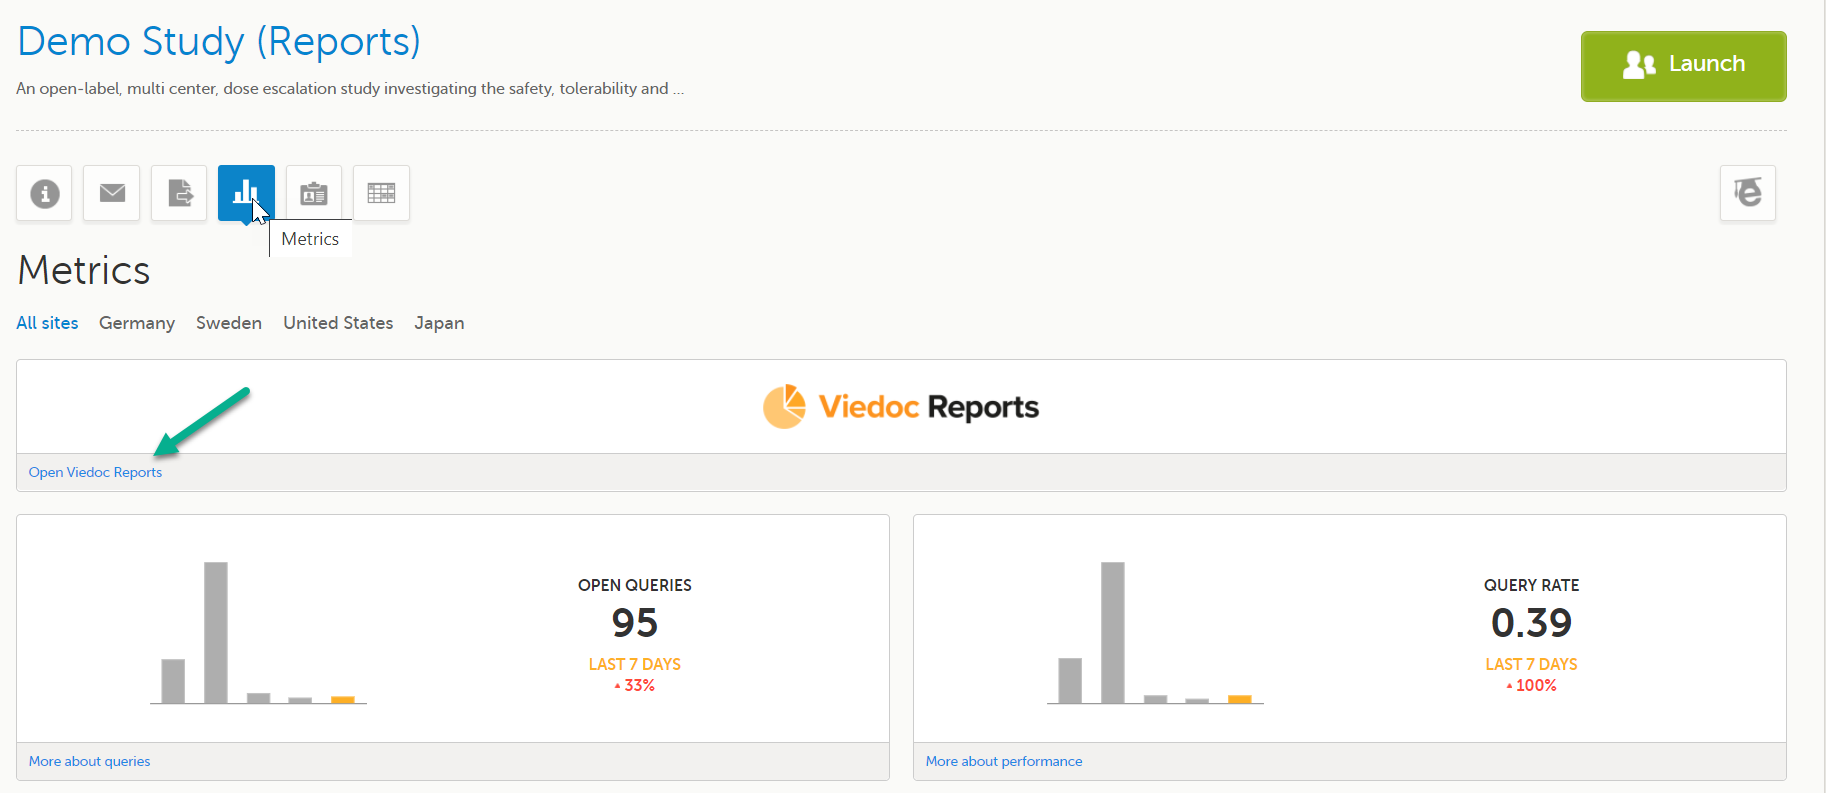
Viedoc Reports is launched from the landing page in Viedoc Clinic from the Metrics feature.
To launch Viedoc Reports:
| 1 |
Log in to Viedoc: 
For more information, see Managing your Viedoc account. |
| 2 |
Select the study you want to work with from the bookshelf: 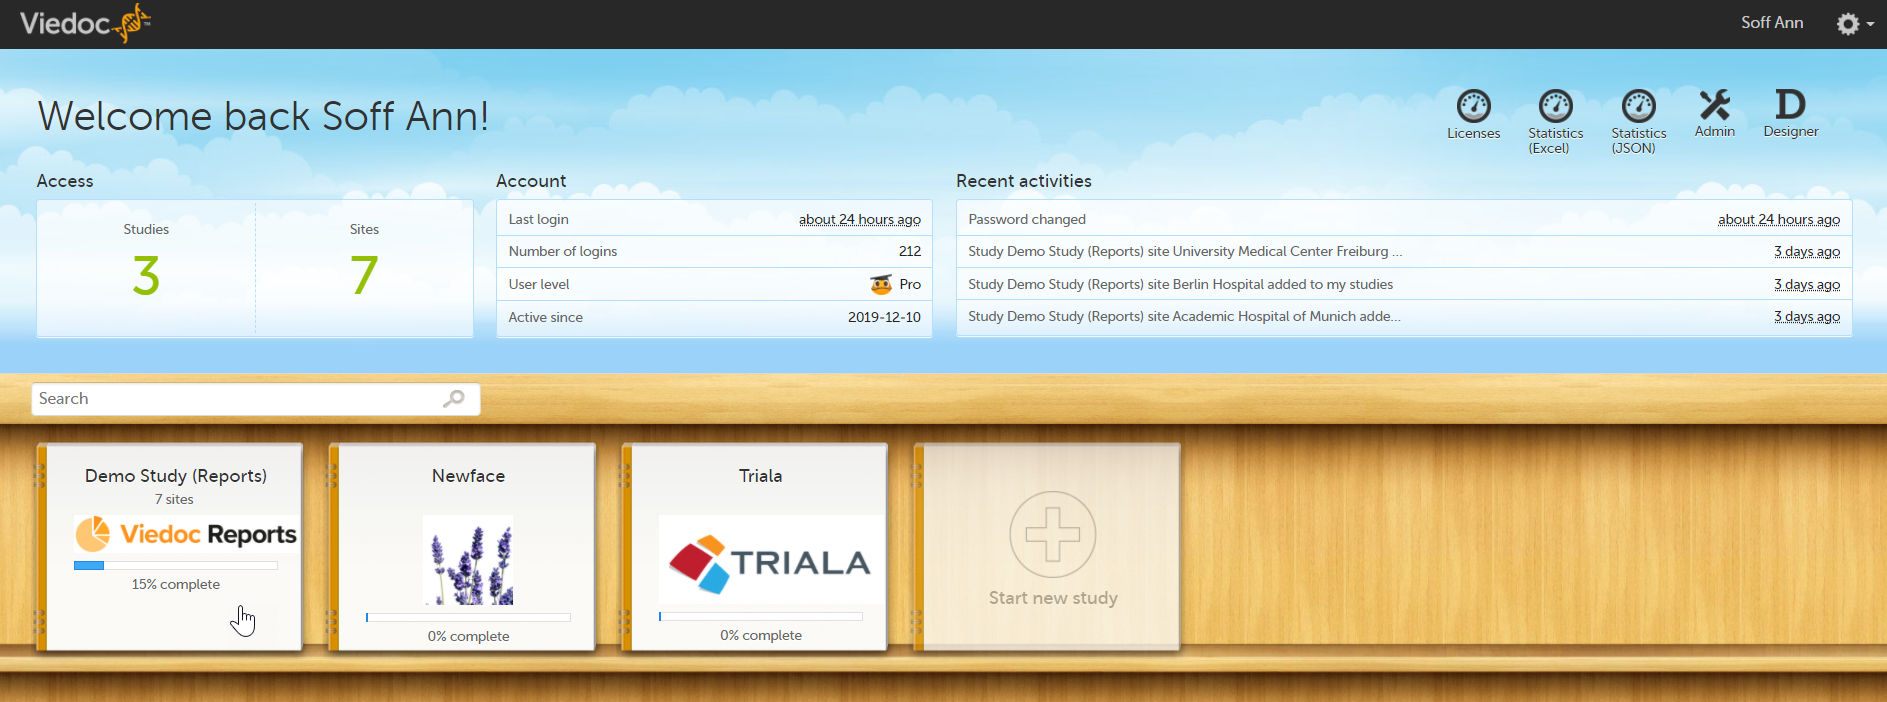 |
|
3 |
Click the Metrics icon on the study start page: 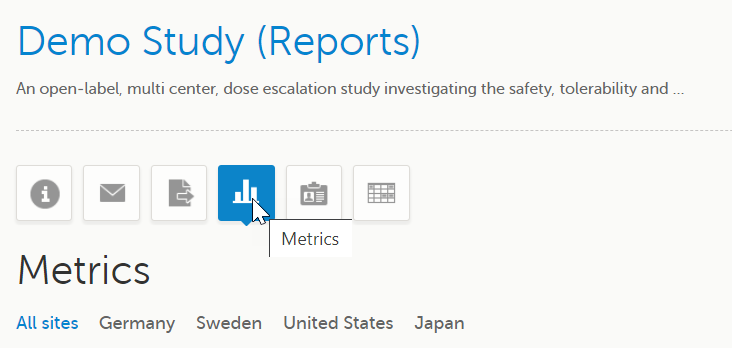
|
| 4 |
Click Open Viedoc Reports: 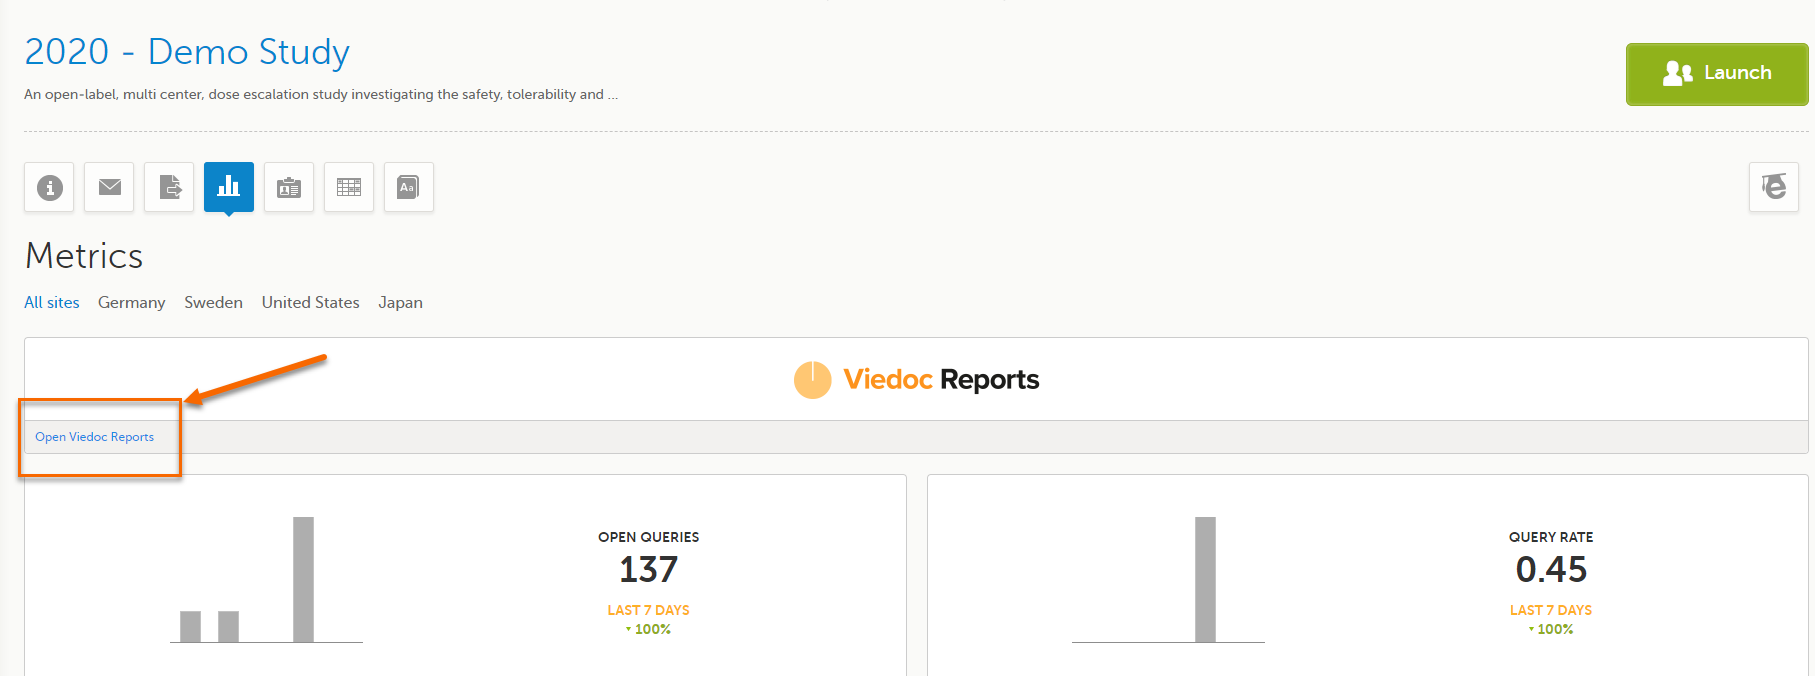
Note! You must be invited with a user role that has the metrics and reports permission enabled to launch Viedoc Reports. |
|
Viedoc Reports opens in a new tab. You're in! 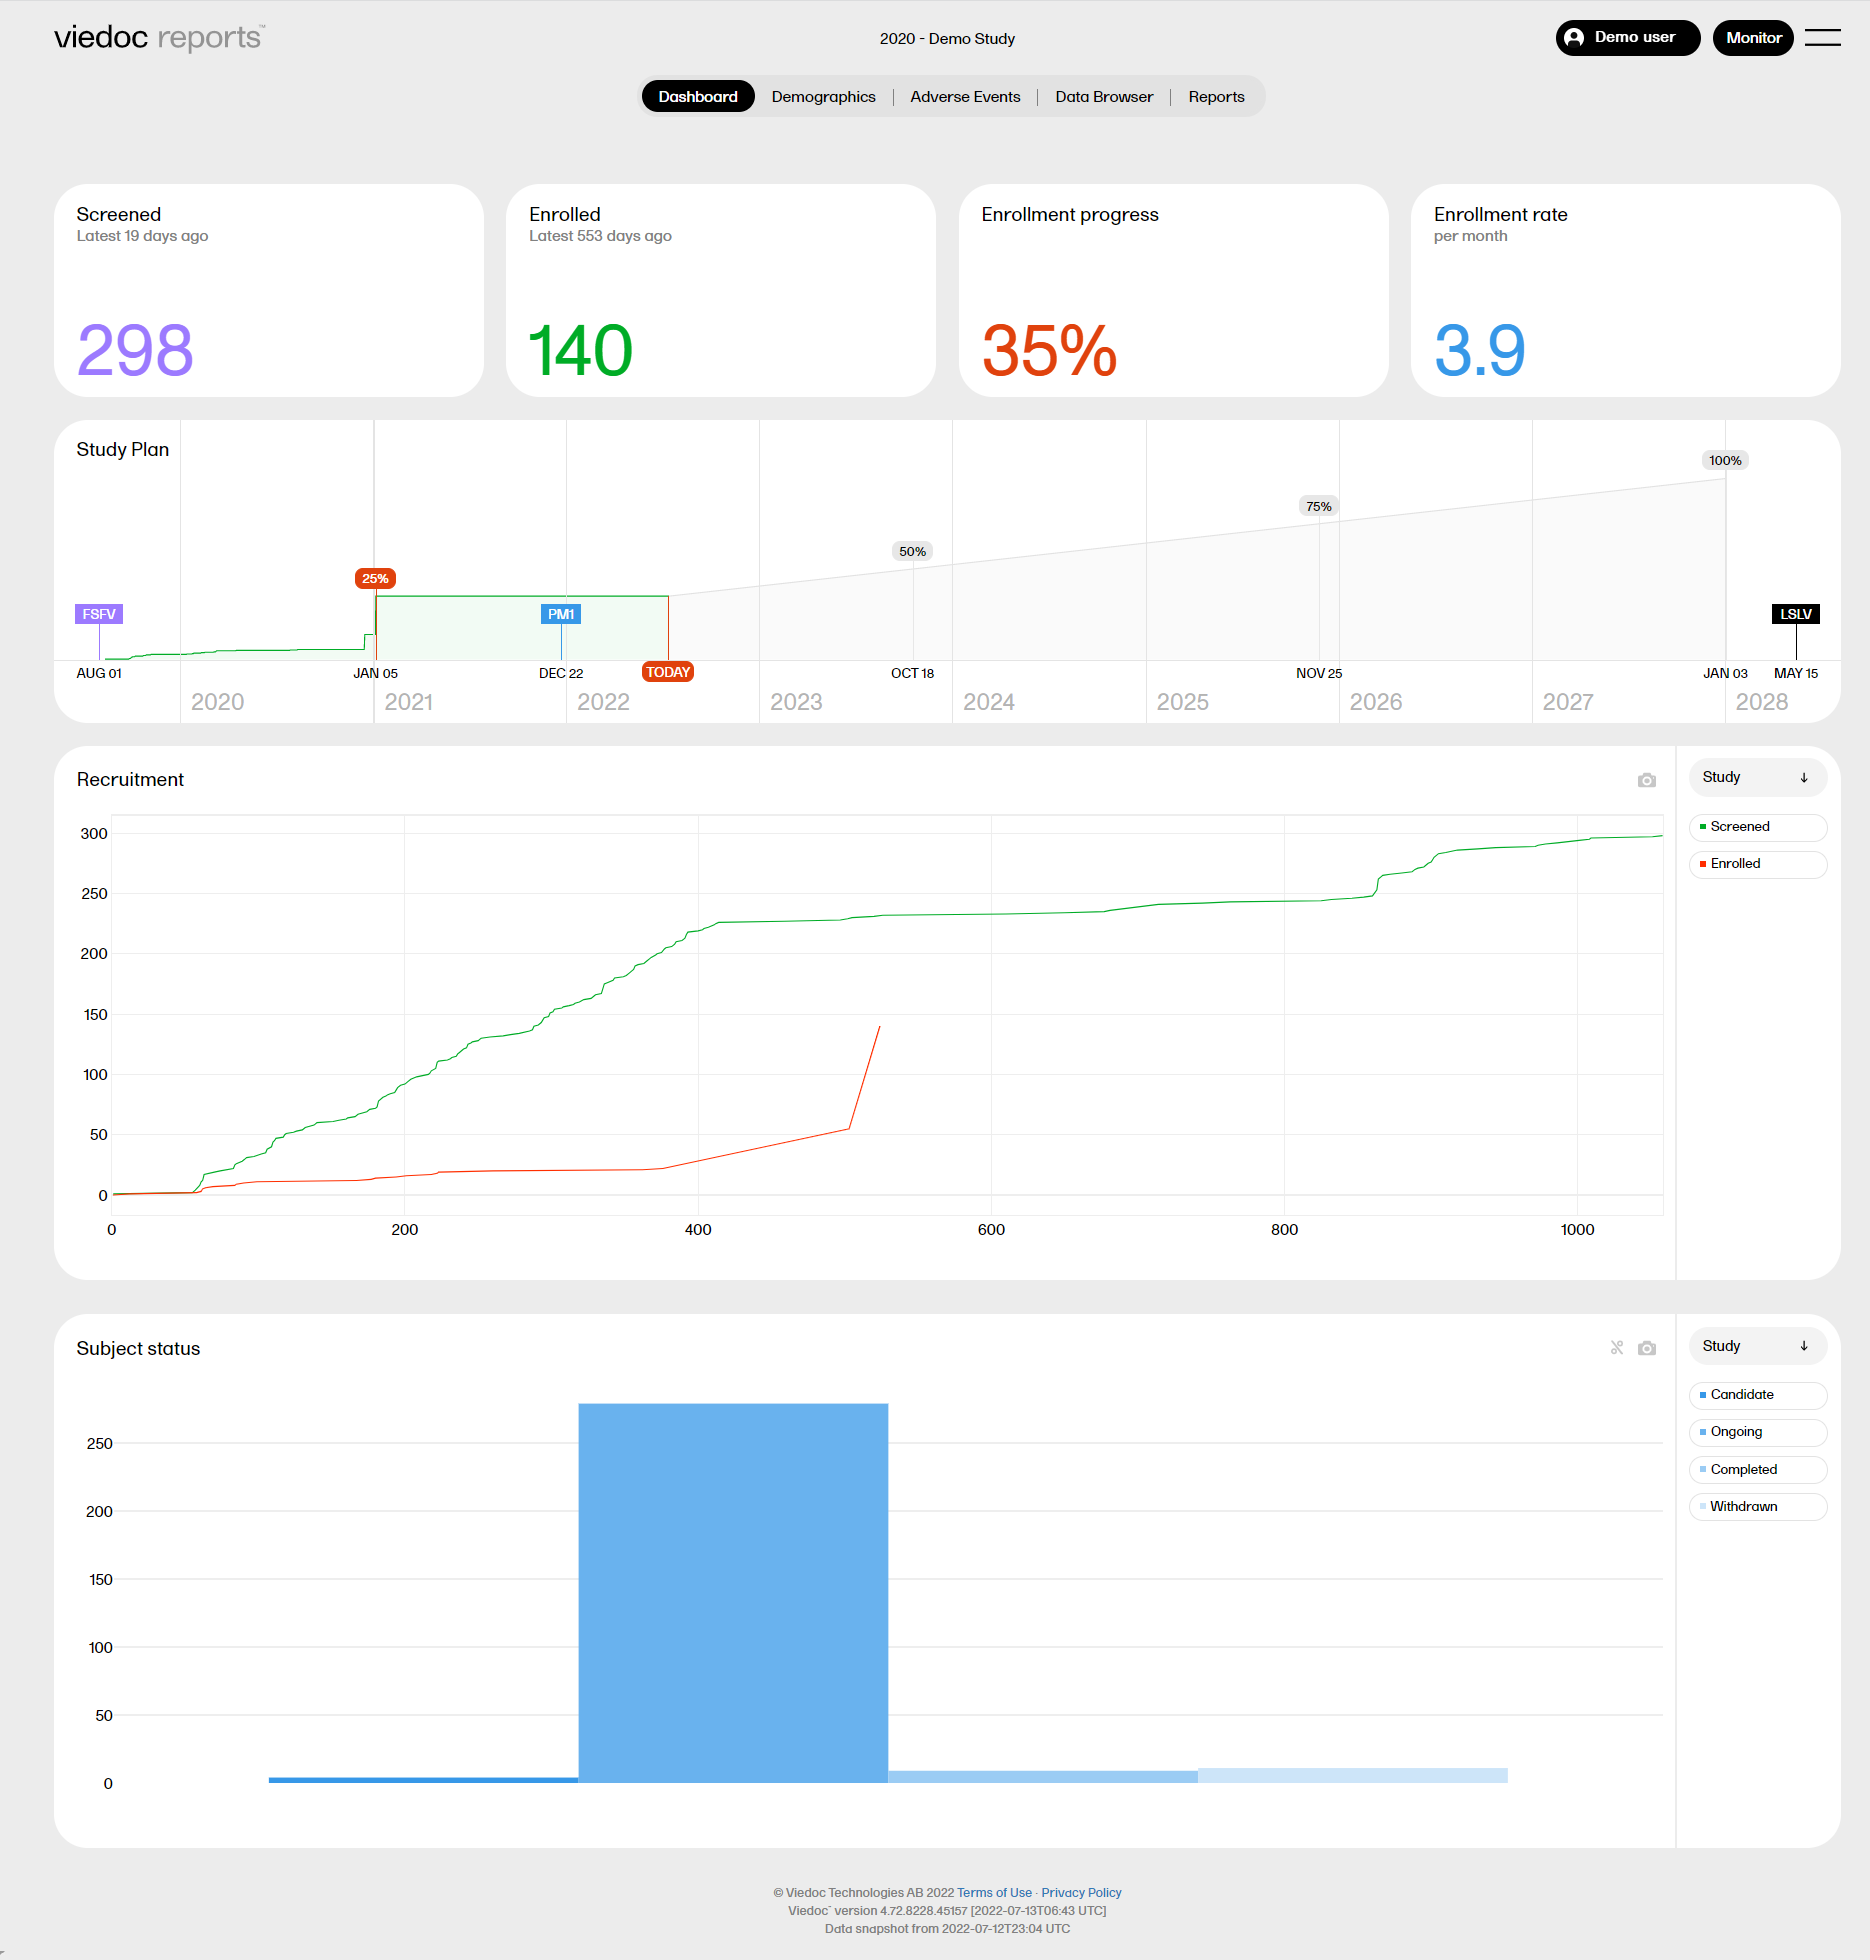
Note! The loading time for the first launch of Viedoc Reports in your study might take several minutes due to the amount of data that has to be imported to populate the graphs. This loading time is only for the first launch for the first user as the data for subsequent loads will already be in place. |
|
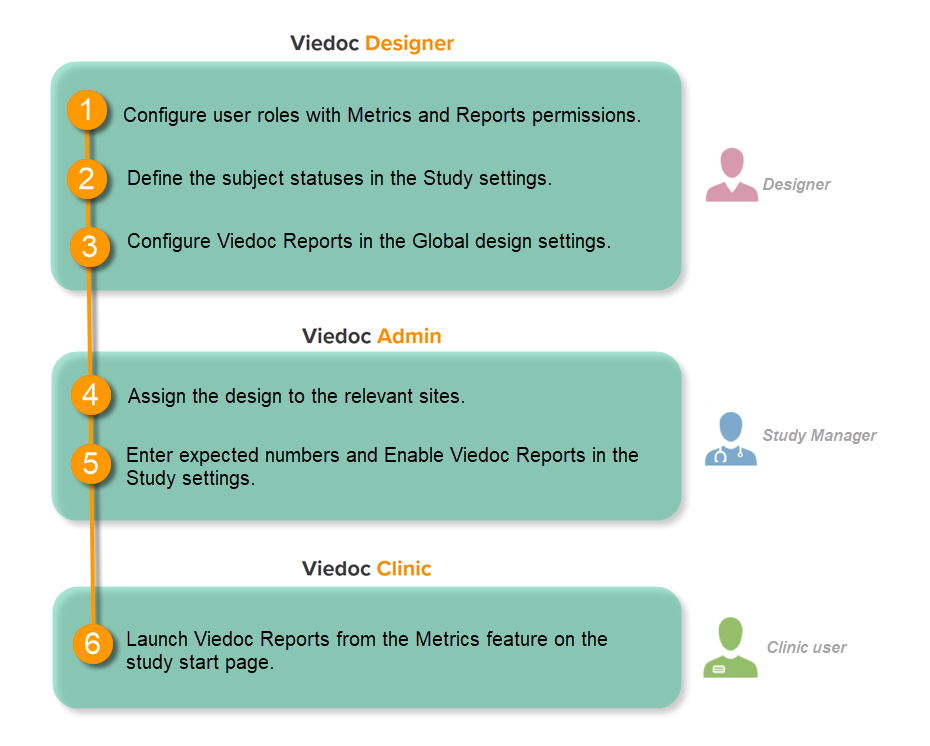
This step is performed by the Designer.
To let Clinic users use Viedoc Reports, their roles must be configured with Metrics and Reports permissions in the Roles page. The Reports option becomes visible when selecting Metrics.
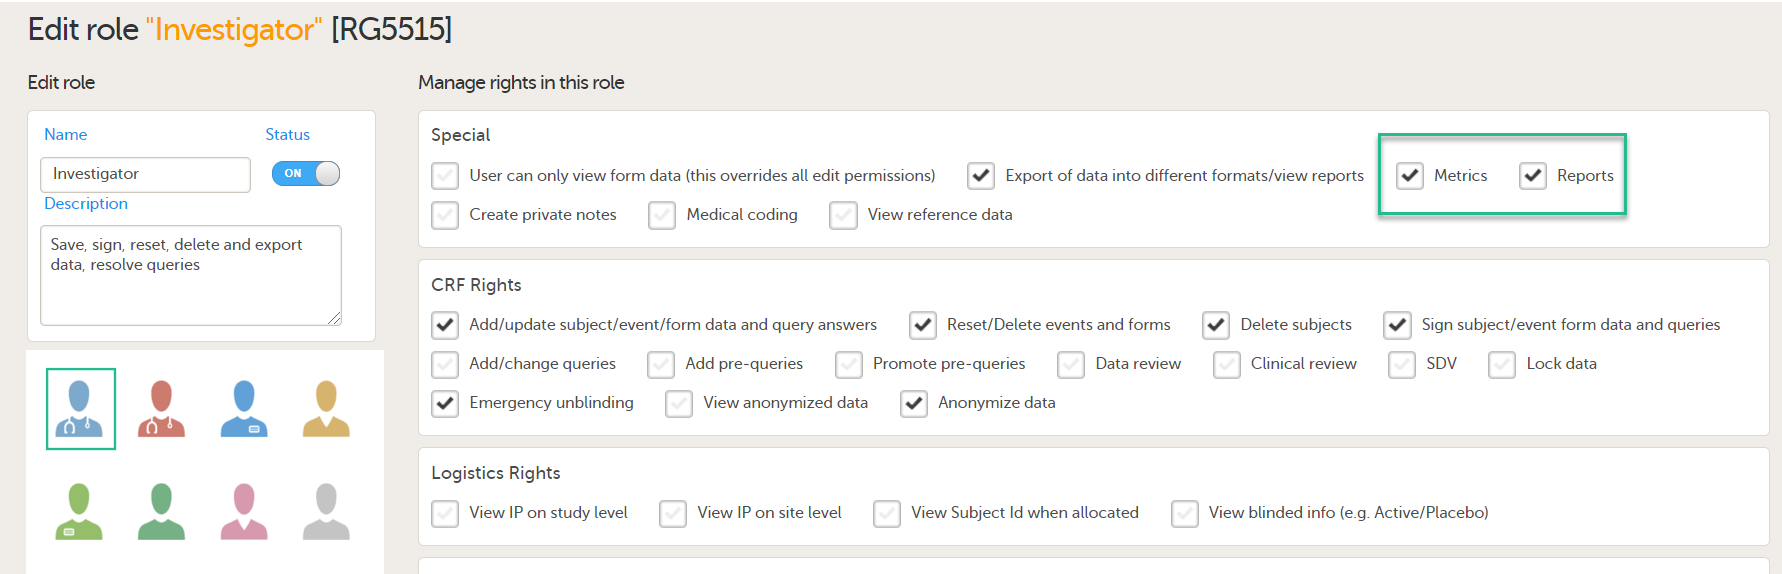
To be able to download report files, the user also needs the permission Export of data into different formats/view reports.
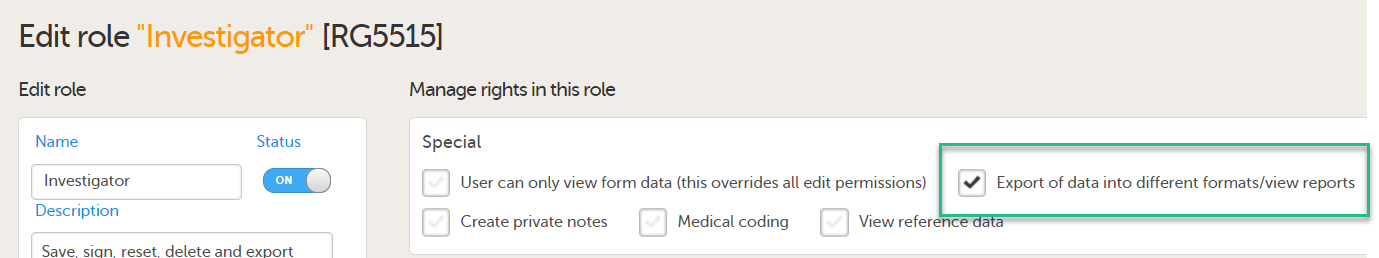
Note! The export is allowed only if the export permission is applicable to all the assigned sites.
See Configuring roles.
This step is performed by the Designer.
Set an expression for how and when a subject is considered both screened and enrolled in the study.
See Subject status.
This step is performed by the Designer.
| 1 |
In Viedoc Designer, select the study for which you would like to configure Viedoc Reports. |
| 2 |
In the Global design settings field, click Edit. 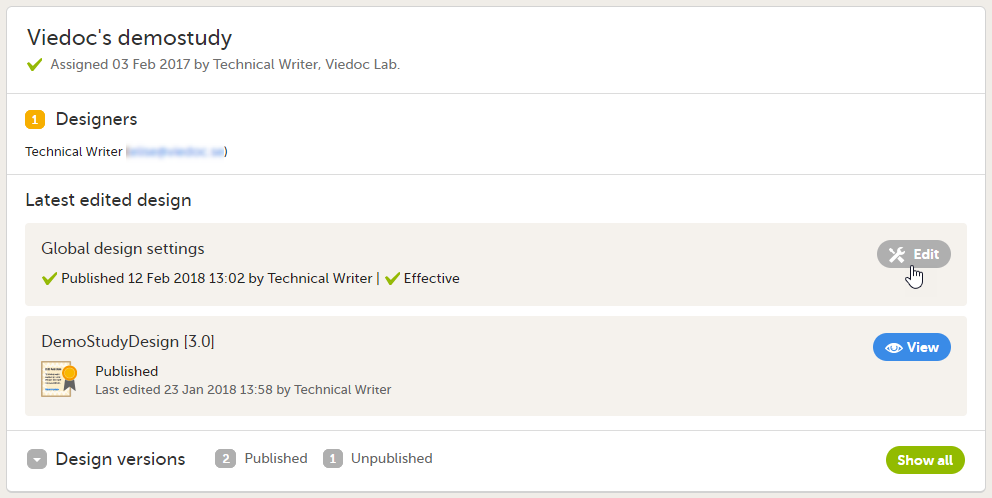
|
| 3 |
In the Reports configuration field, click Edit. 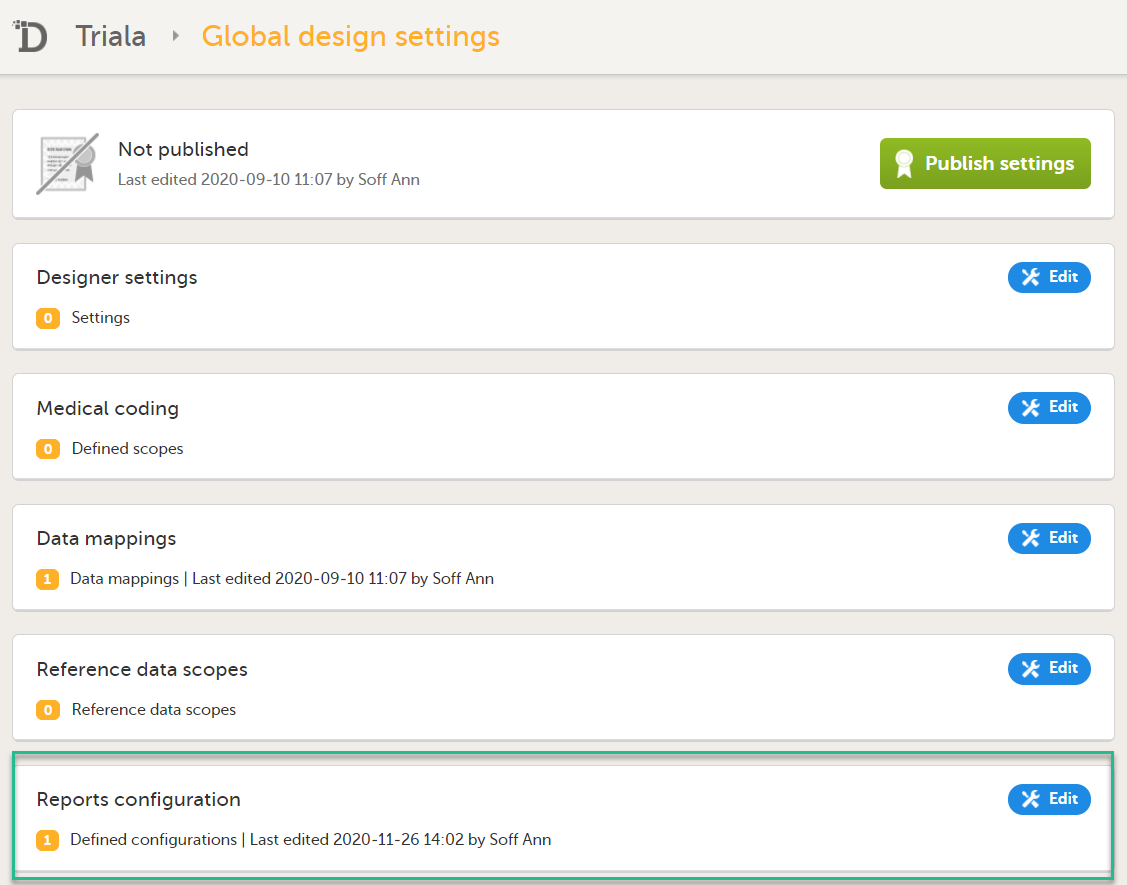
|
| 4 |
You can now configure the settings by clicking Edit in one of the fields: Visibility settings, Dashboard, Demographics, Adverse events, and Custom reports. See Configuring Viedoc Reports for details. 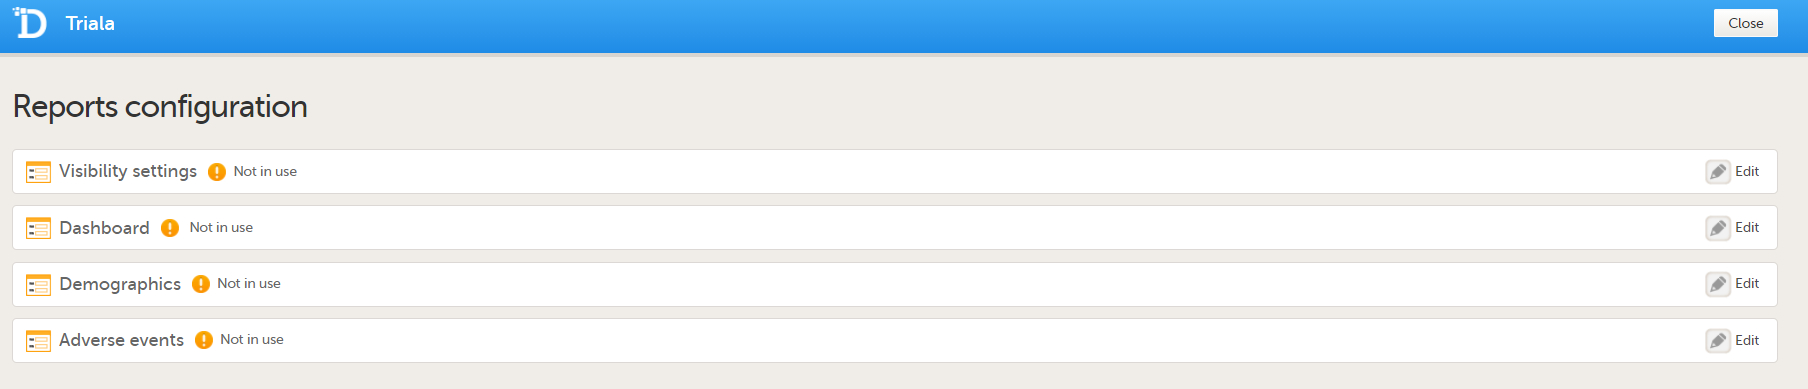
After editing and saving any changes, the Not in use status changes to In use. |
| 5 |
Publish your global design settings. 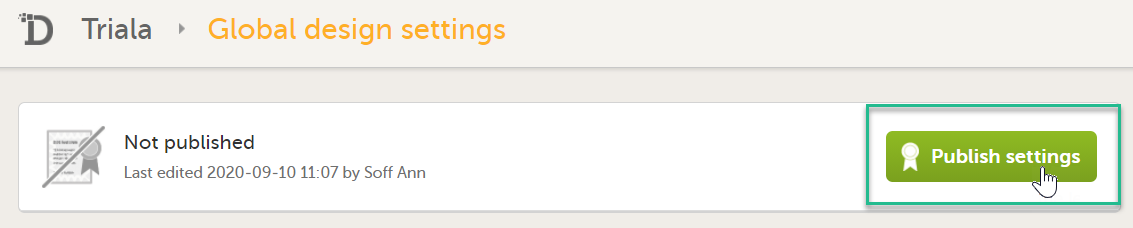
|
| 6 | Publish your design. See Publishing a study design. |
This step is performed by the Study Manager.
This step is performed by the Study Manager.
| 1 |
Click Study settings for the study in which you want to set up Viedoc Reports. 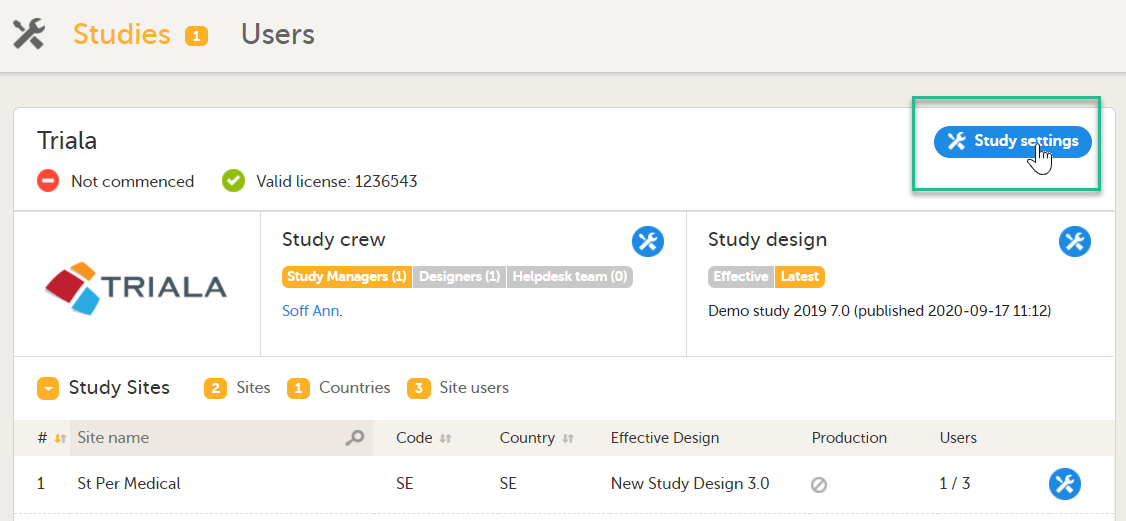
|
| 2 |
In the Study settings pop-up window, enter the total number of expected screened and enrolled subjects and the expected end date of the enrollment period. 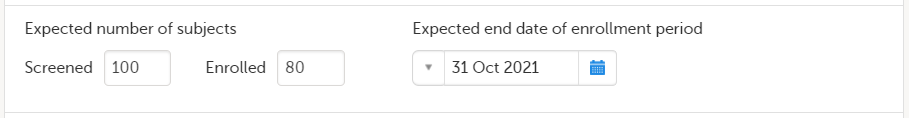
Note! This data must be entered on both study level and for each individual site. |
| 3 |
Scroll down to and click Show more options. 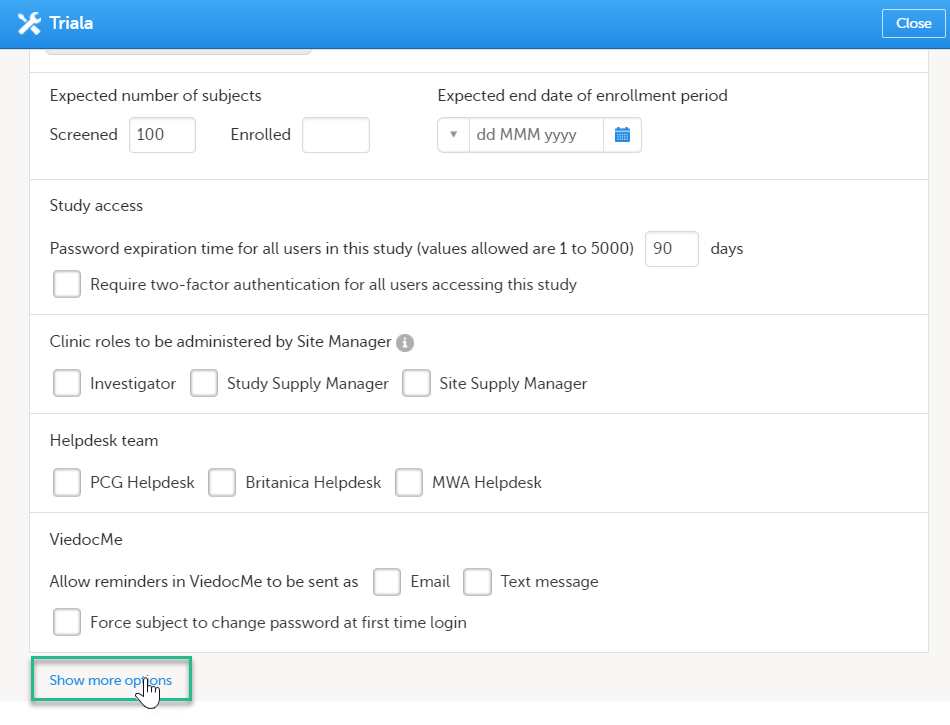
|
| 4 |
Select Enable Viedoc Reports and click Save changes. 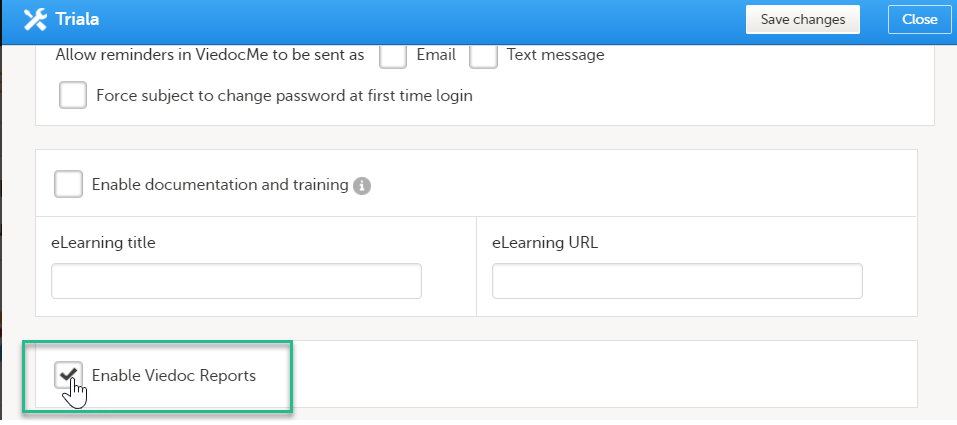
|
This step is performed by the Clinic user.
Launch Viedoc Reports from the Metrics feature on the study start page.
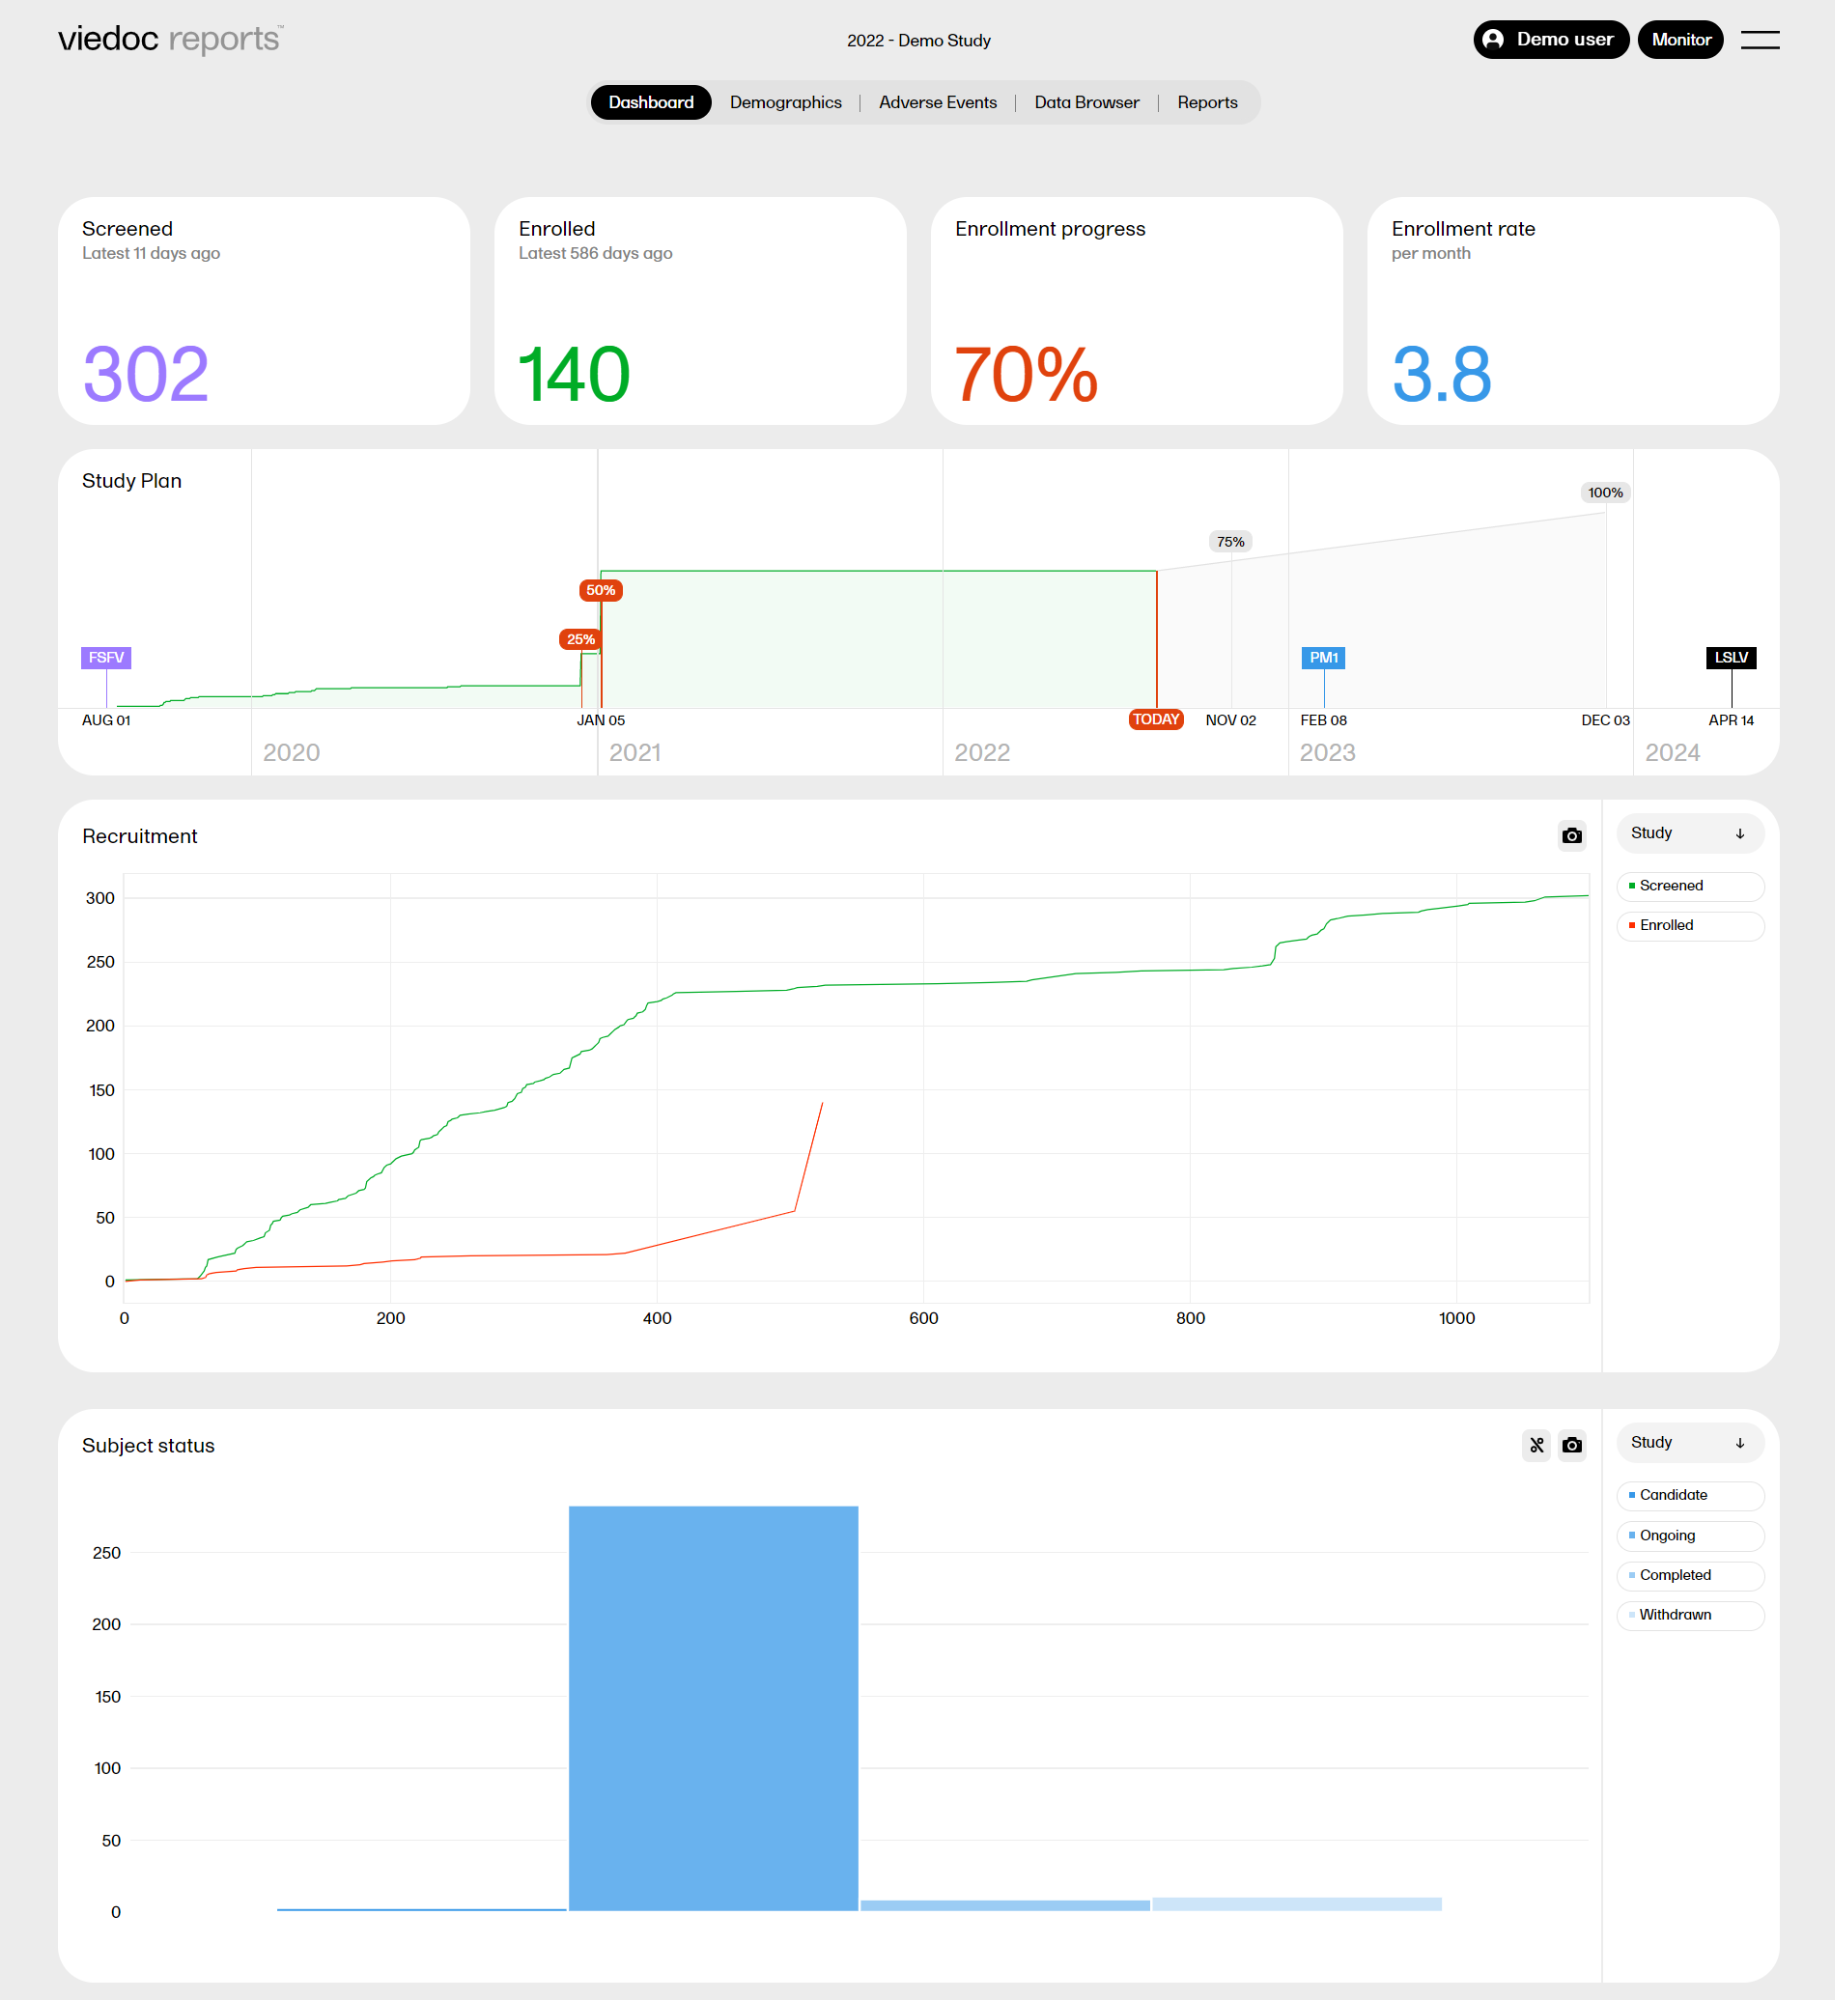
When launching Viedoc Reports, you land on the Dashboard page. This page shows summaries of the whole study with high-level plots to quickly get an overview of the study status. You can also see more detailed information by zooming, toggling, hovering, and more. See Tools for more information.
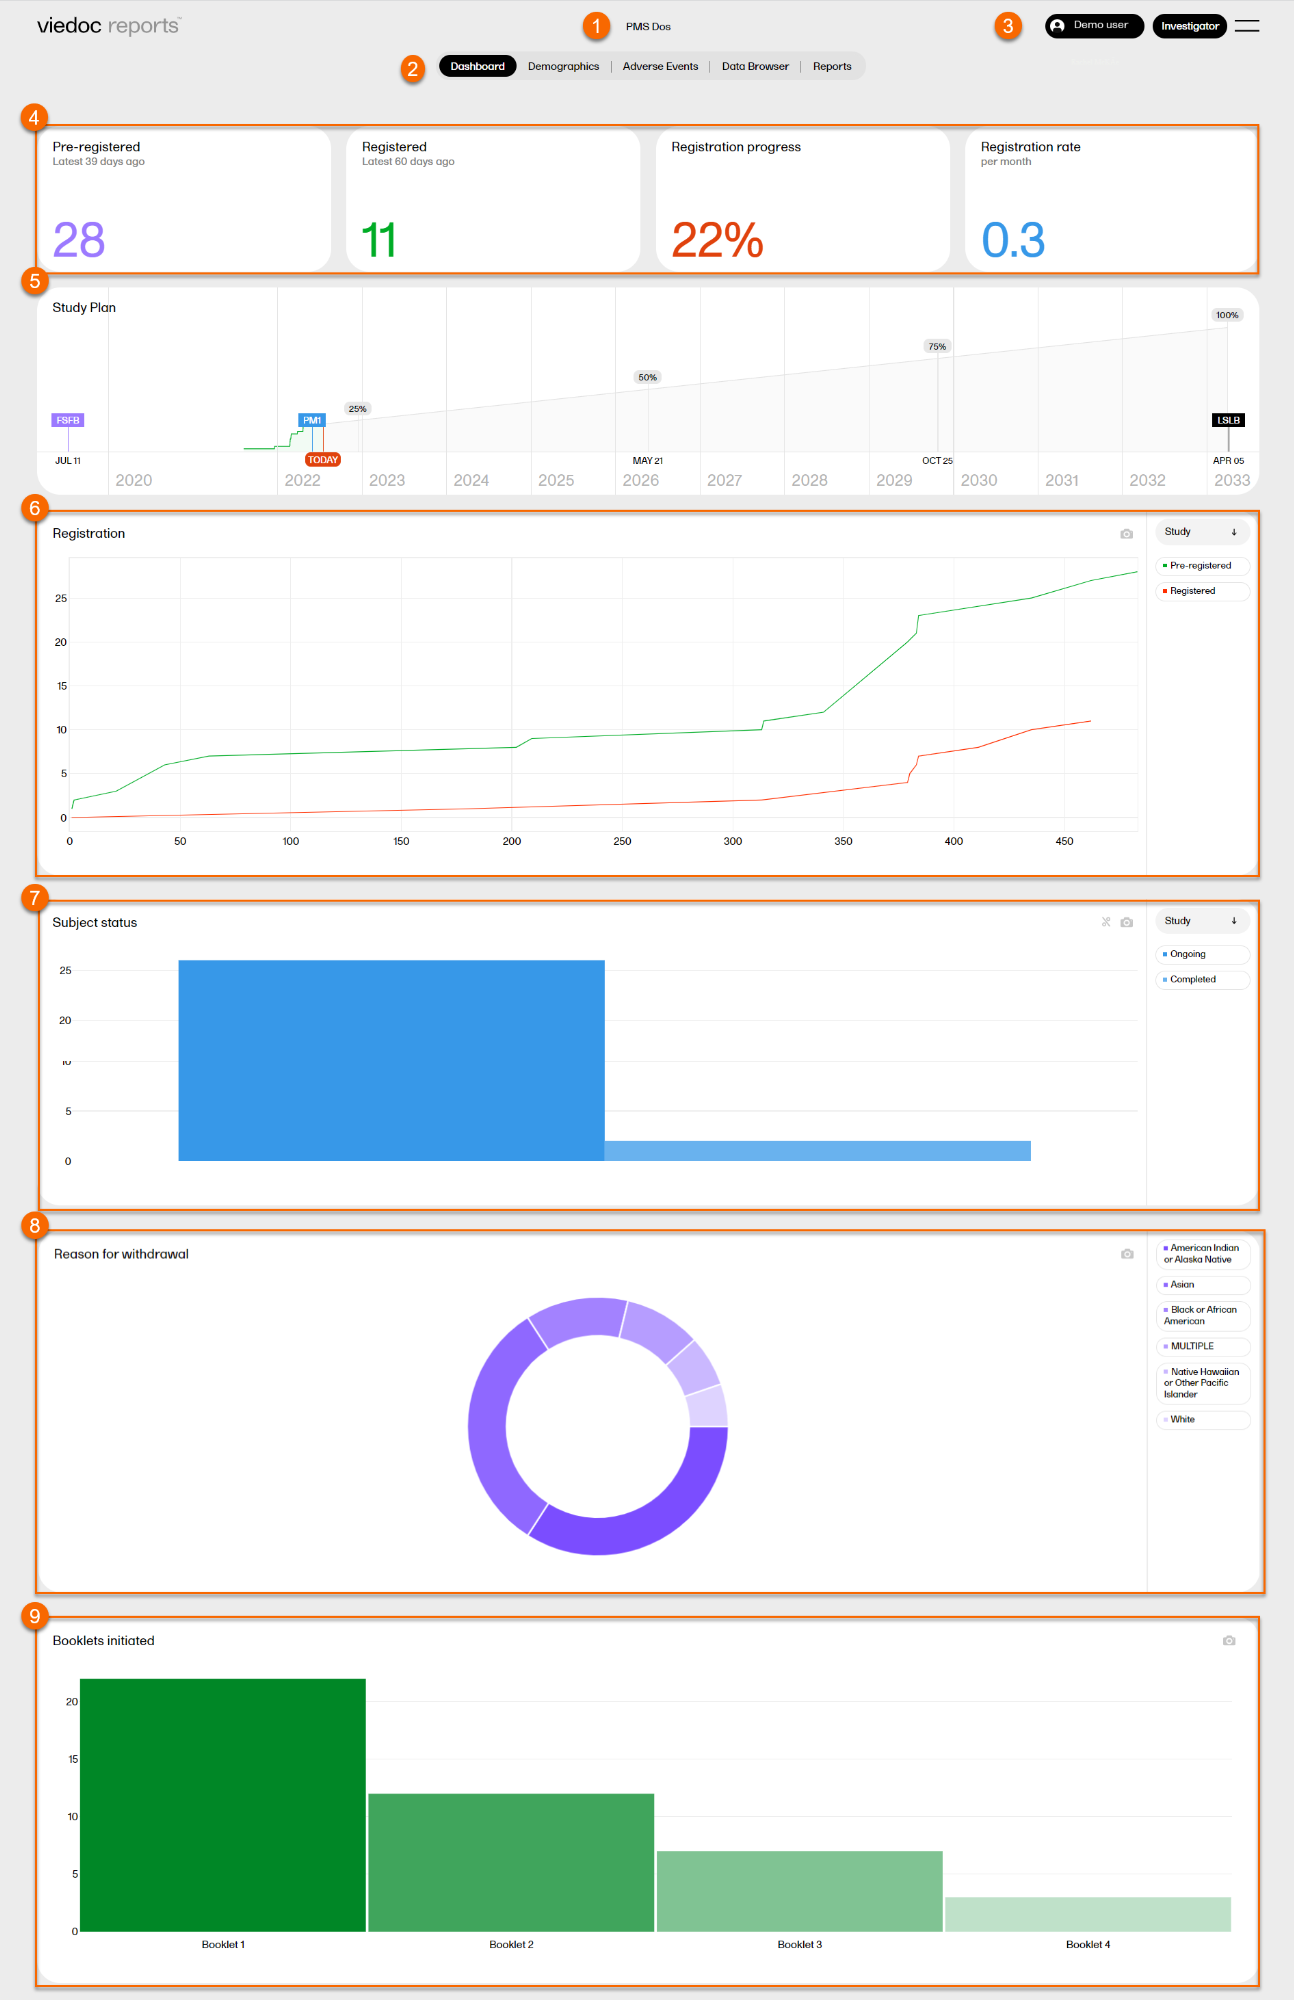
The Dashboard page gives snapshots of the recruitment and study progress, with data highlighted in different ways and angles.
The plots on the page complement each other, and by observing trends from each one, you get a good all-round understanding of the study progress and performance.
Note! Japanese PMS studies have a specific dashboard.
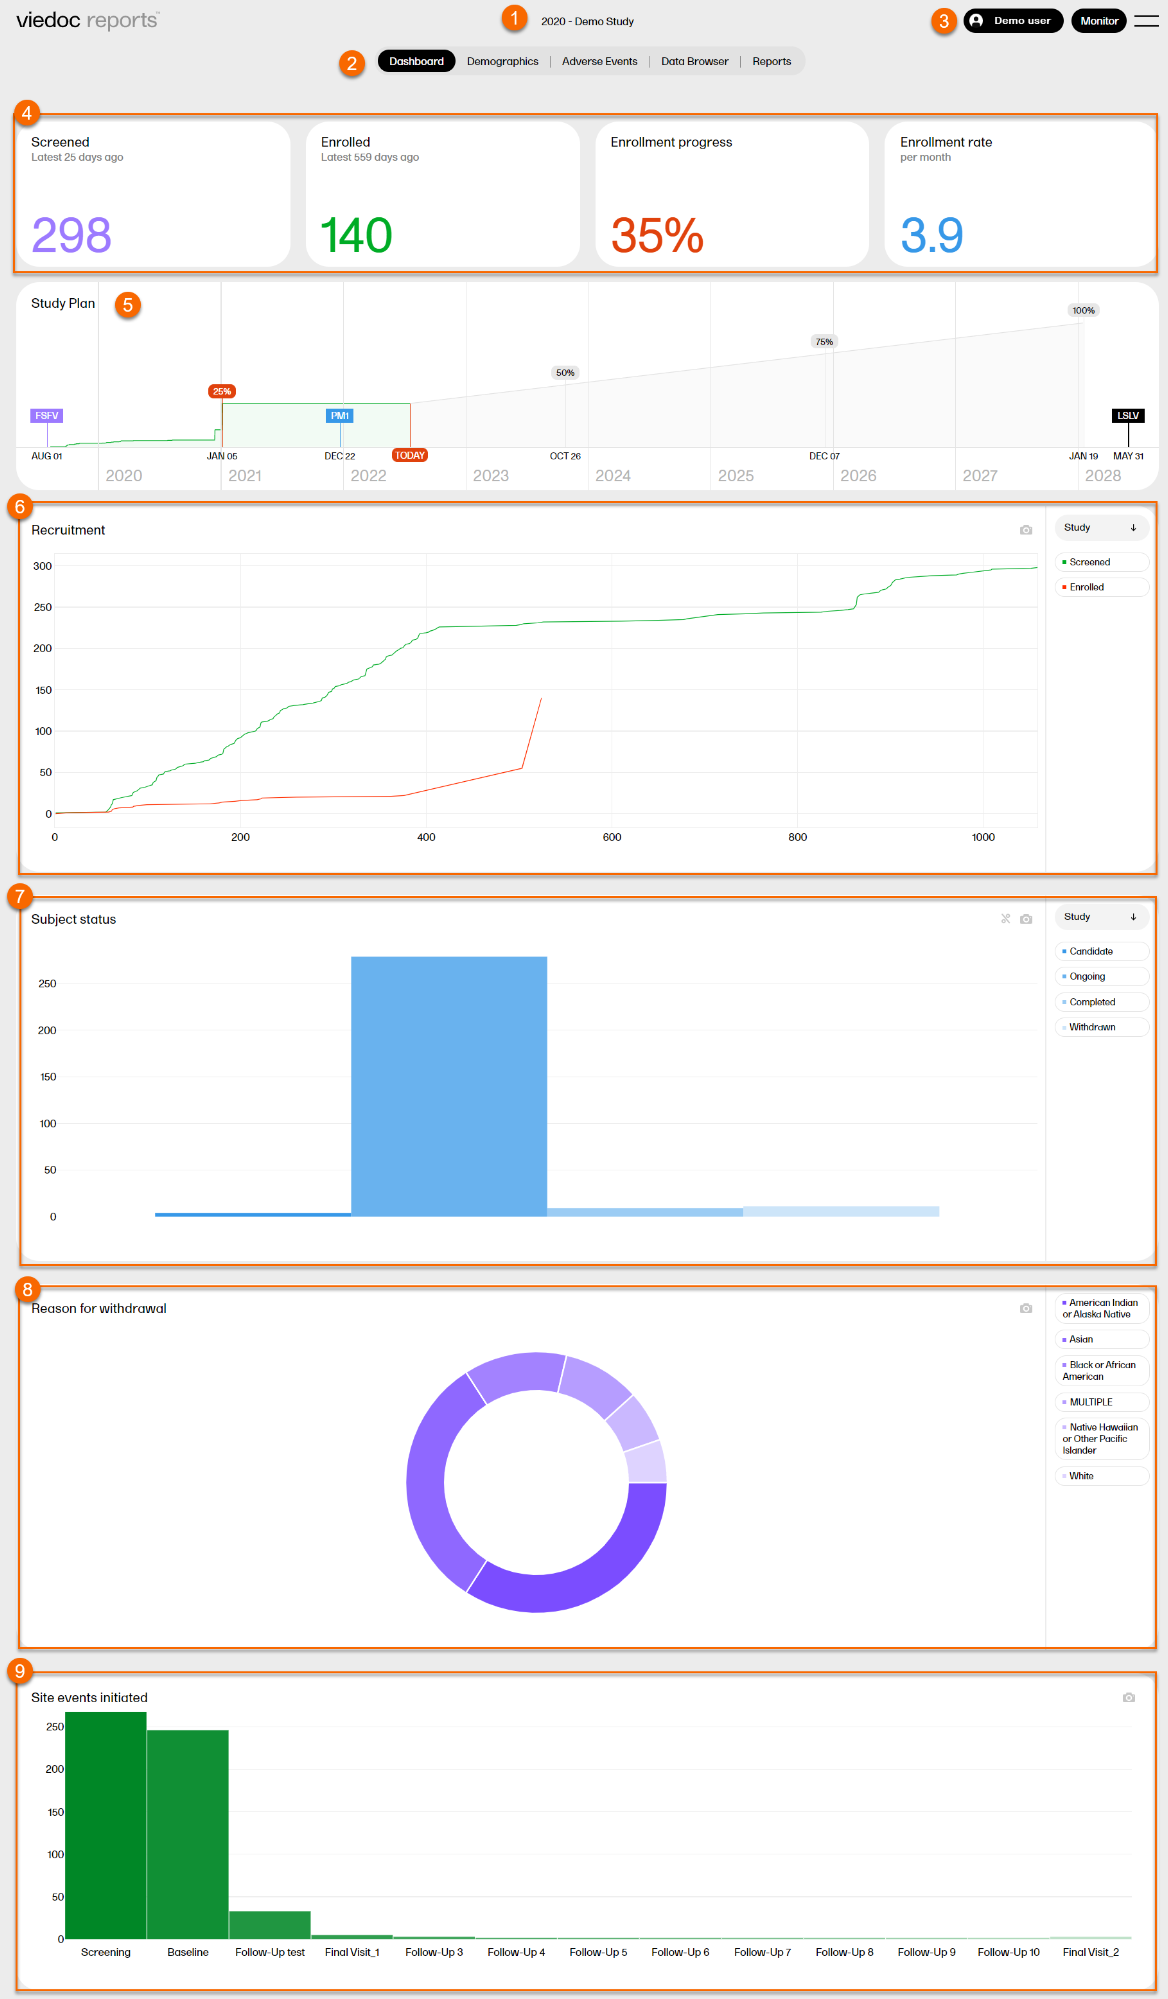
1. Study name
2. Page menu - Dashboard (current page), Demographics, Adverse Events, Data Browser, Reports.
3. User name, role, and a dropdown menu with settings to personalize the interface by choosing a color palette, language settings (English), and logout.
4. Recruitment status
5. Study plan
6. Recruitment plot
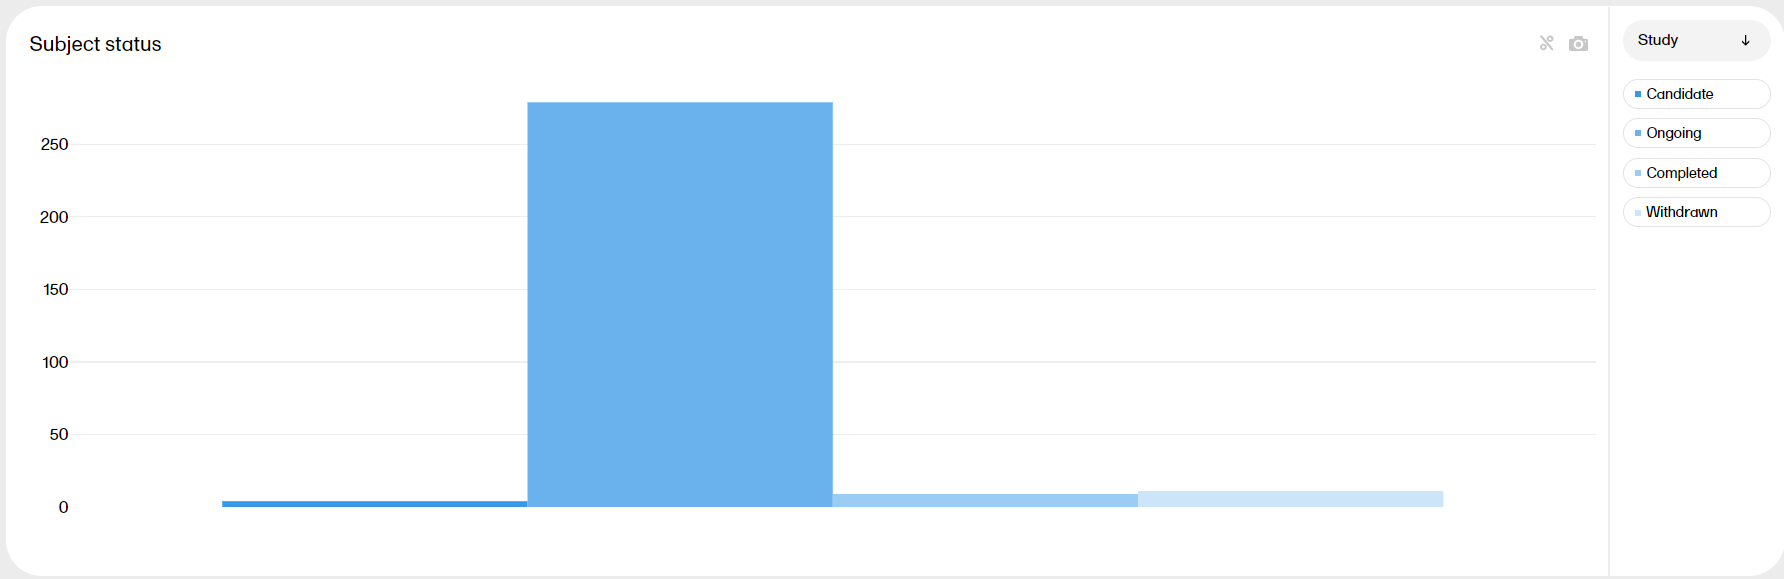
7. Subject status plot
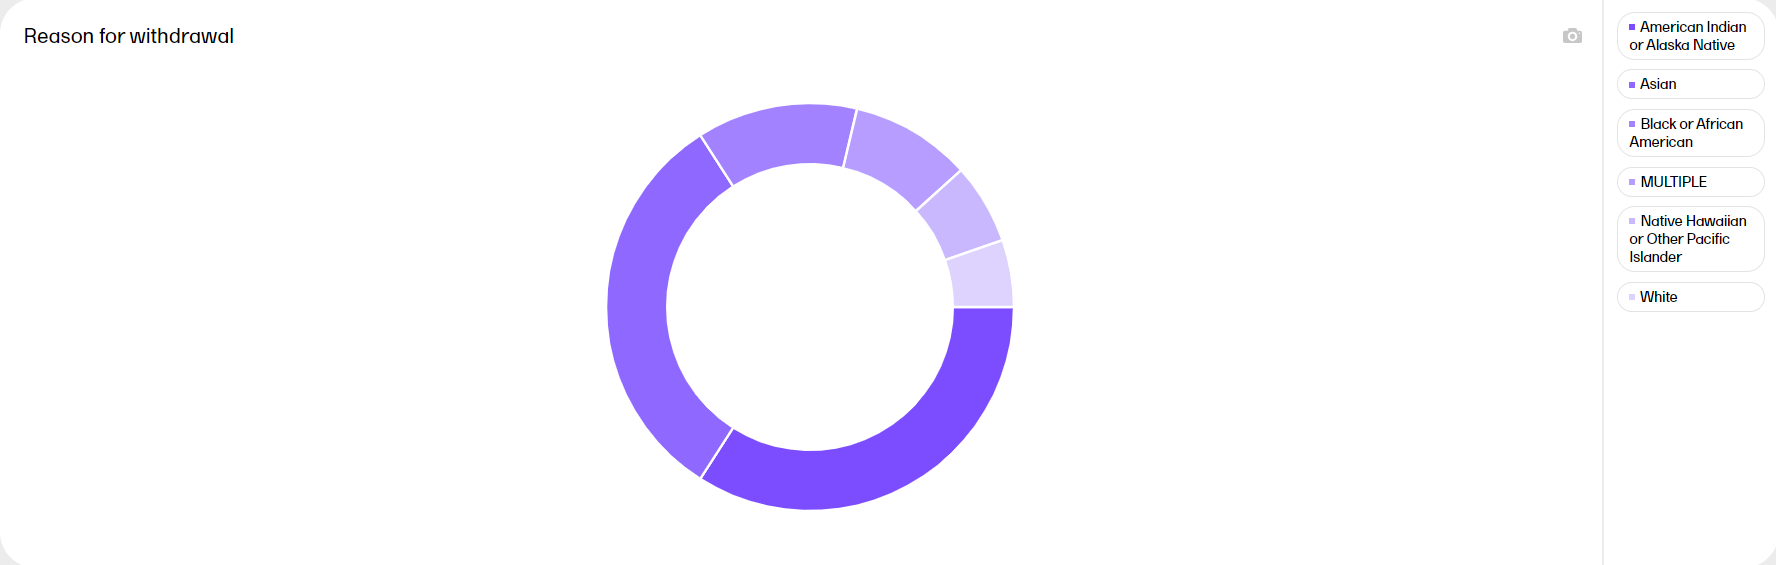
8. Reason for withdrawal plot
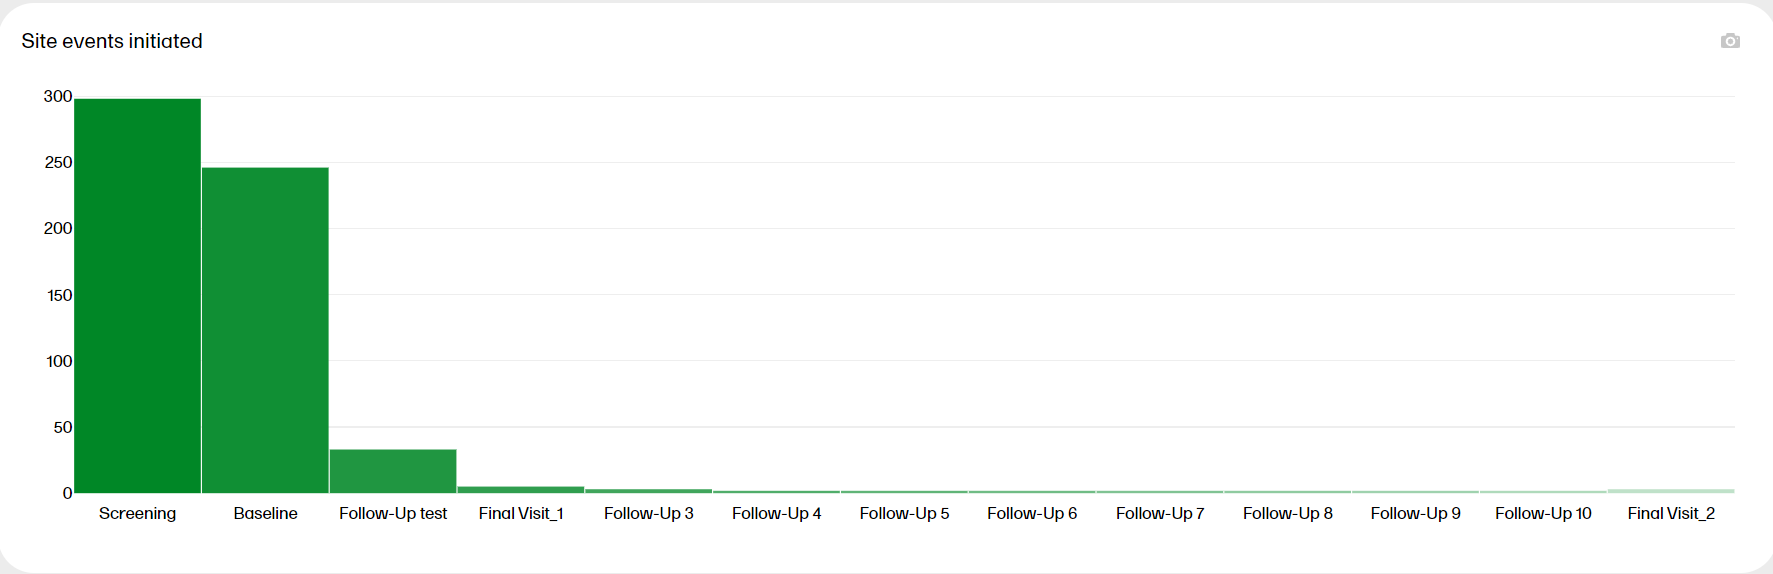
9. Site events initiated plot
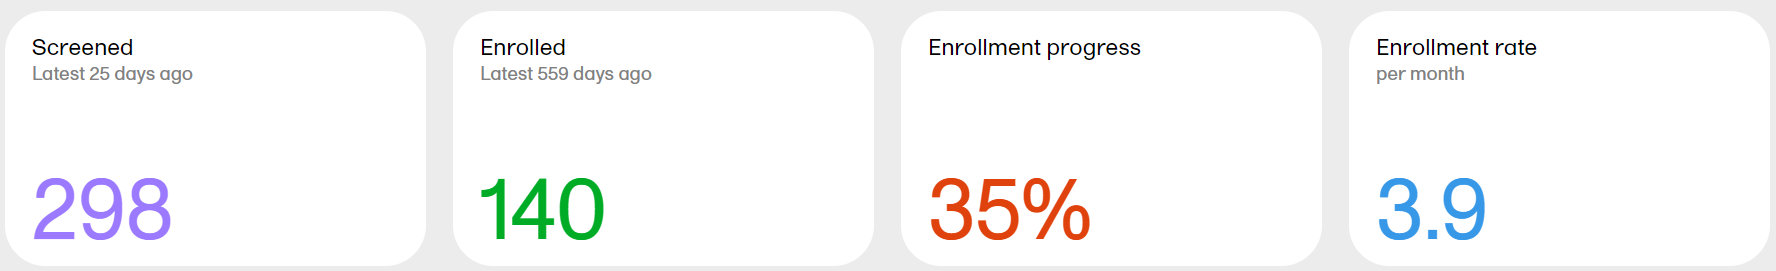
Screened - the total number of screened subjects* and the number of days since the latest screening.
Enrolled - the total number of enrolled subjects* and the number of days since the latest enrollment.
Enrollment progress - the actual number of enrolled subjects divided by the expected number of enrolled subjects. The expected number of enrolled subjects is taken from what has been set in Viedoc Admin by the Study Manager. The value can go above 100% if the sites enroll more than the expected number of subjects.
Enrollment rate - the speed at which the subjects are being enrolled across the sites. Until the study is 11 weeks from FSFV (first subject first visit), the rate is displayed as number of subjects/week. After 11 weeks, the rate is displayed as number of subjects/month. The blue line is a snapshot of the latest 11 weeks/months, giving a visual cue of the recruitment trend.
*as per the definition in Viedoc Designer.
The Study plan shows the recruitment progress and contains markers with completed and predicted milestones. The Study plan serves as a forecast for when the study can be expected to reach these milestones.
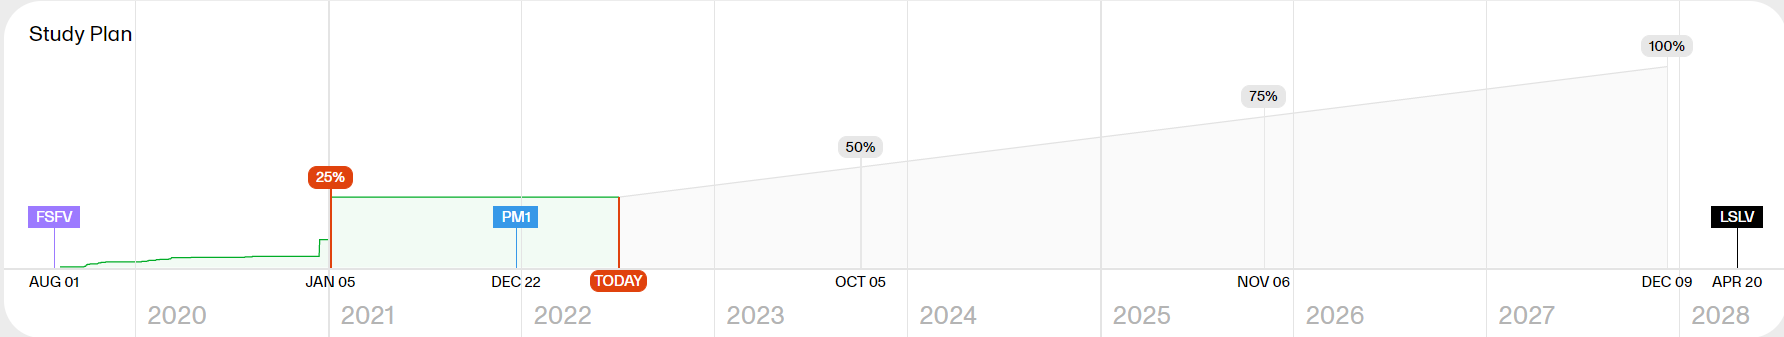
Note! As the Study plan needs data from the study to be generated, it is visible when 5% of the enrollment has occurred and is then continuously shaped by the performance data.
The Study plan shows the following markers:
Tip! You can hover over a marker in the study plan to see more details.
The green part represents the actual enrollment so far. From the study settings we know the “Expected Enrollment” for the study. Based on these two data points, along with the total number of days it took to enroll so far, the remaining milestones are extrapolated.
For example:
Expected enrollment for the study as per study settings = 300 subjects
Actual enrollment so far = 60 subjects
Total number of days so far since the first enrollment = 120 days
% of enrollment completed so far = 60/300 = 20%
So, the extrapolations are as below:
Actual: 20% of enrollment took 120 days
Estimate: 25% of enrollment will take (25 * 120)/20 = 150 days
Estimate: 50% of enrollment will take (50 * 120)/20 = 300 days
Estimate: 75% of enrollment will take (75 * 120)/20 = 450 days
Estimate: 100% of enrollment will take (100 * 120)/20 = 600 days
This estimate along with the user-provided Expected Enrollment Completion Date (provided via study settings) represented in the study plan via the PM1 marker will help you to understand whether the current rate of recruitment is sufficient to reach the target.
The Recruitment plot shows the number of screened and enrolled subjects over time. You can select to view the plot sorted per Study, Country, or Site, by clicking the dropdown menu to the right.
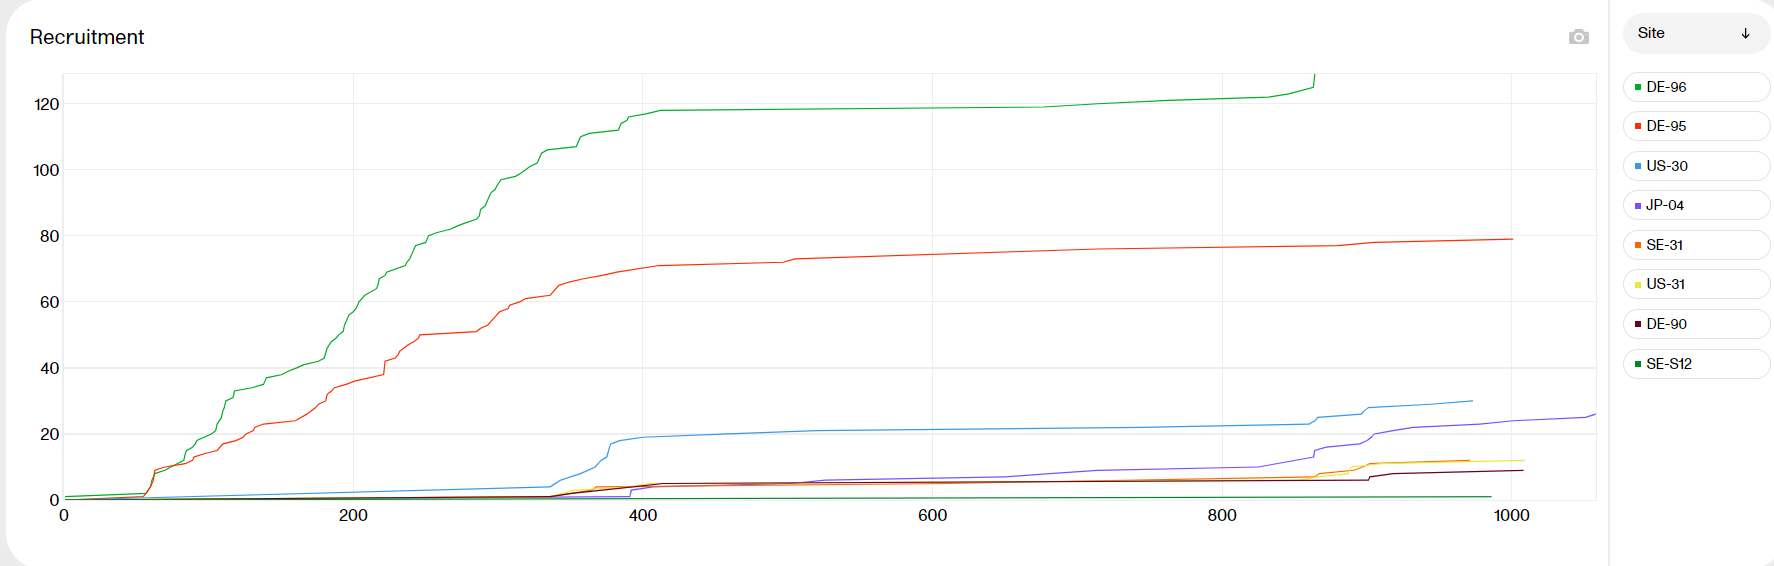
Hover over a graph at any given point to show the following information:
Day: the day of the point (day 1 is FSFV)
Date: the date of the point
Screened/Enrolled today: the number of screened/enrolled subjects at this date
Cumulative: the number of screened/enrolled subjects up to this point in time
| Zoom | Click and drag any given area to zoom in. Double-click to zoom out. |
| Hide | Click a title in the legend to hide the graph in the plot. Click again to make it re-appear. |
| Download | Click the camera symbol to take a snapshot of the plot. A .png file will be downloaded to your computer. |
| Scale | Hover over the axis to make a double arrow appear. Then click and drag the arrows to scale the axis. |
The Subject status plot shows the subject status distribution in the study, sorted by:
*as per the definition in Viedoc Designer.
You can select to view the plot sorted per Study, Country or Site, by clicking the dropdown menu to the right.
| Zoom | Click and drag in any given area to zoom in. Double-click to zoom out. |
| Hide | Click a title in the legend to hide the graph in the plot. Click again to make it re-appear. |
| Download | Click the camera symbol to take a snapshot of the plot, A .png file will be downloaded to your computer. |
| Toggle | Click the % symbol to toggle the graph to a view with a 100% stacked bar. Click again to go back to the previous view. Toggling the bars shows the relationship between them, visualized on top of each other instead of side by side. |
| Scale | Hover over the axis to make a double arrow appear. Then click and drag the arrows to scale the axis. A blue arrow indicates that there are more bars out of view on the X-axis. |
The Reason for withdrawal plot shows the distribution of reasons for withdrawal from the study. MULTIPLE indicates that there are several reasons for the withdrawal of the subject.
Hover over a slice to display the exact number of subjects and the percentage of total subjects.
| Hide | Click a title in the legend to hide the graph in the plot. Click again to make it re-appear. |
| Download | Click the camera symbol to take a snapshot of the plot, A .png file will be downloaded to your computer. |
The Site events initiated plot shows the progress of the scheduled events in the study. Hover over a bar to display the exact number of subjects.
| Zoom | Click and drag in any given area to zoom in. Double-click to zoom out. |
| Download | Click the camera symbol to take a snapshot of the plot, A .png file will be downloaded to your computer. |
| Scale | Hover over the axis to make a double arrow appear. Then click and drag the arrows to scale the axis. A blue arrow indicates that there are more bars out of view on the X-axis. |
| Zoom |
Click and drag in any given area to zoom in. Double-click to zoom out. 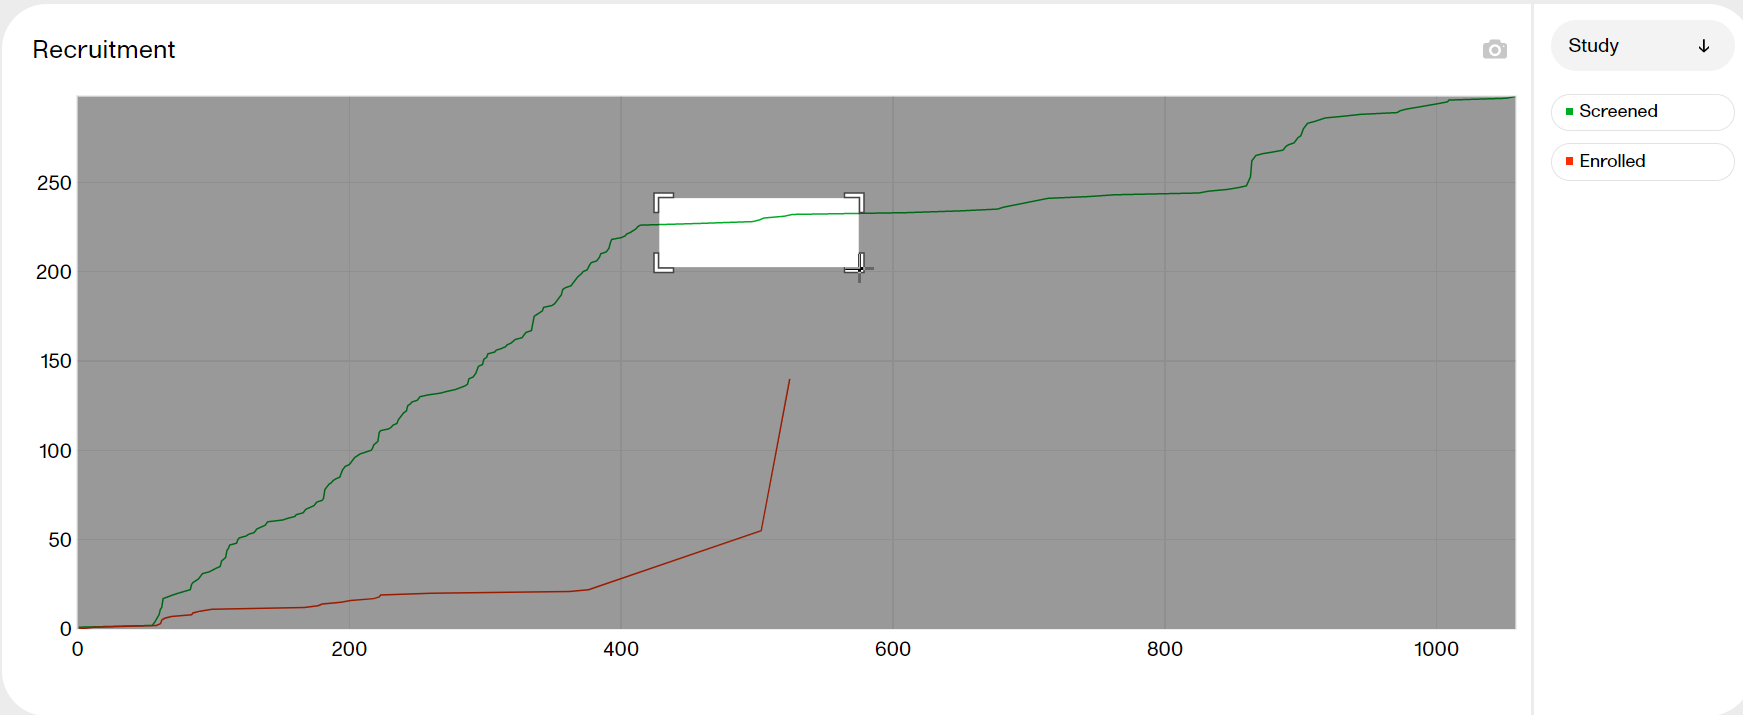
|
| Hide |
Click a title in the legend to hide the graph. Click again to make it re-appear. 
|
| Download |
Click the camera symbol to take a snapshot of the plot. A png file will be downloaded to your computer. |
| Toggle |
Click the 
|
| Scale |
Hover over the axis to make a double arrow appear. Then click and drag the arrows to scale the axis. A grey arrow indicates that there are more bars out of view on the X-axis. 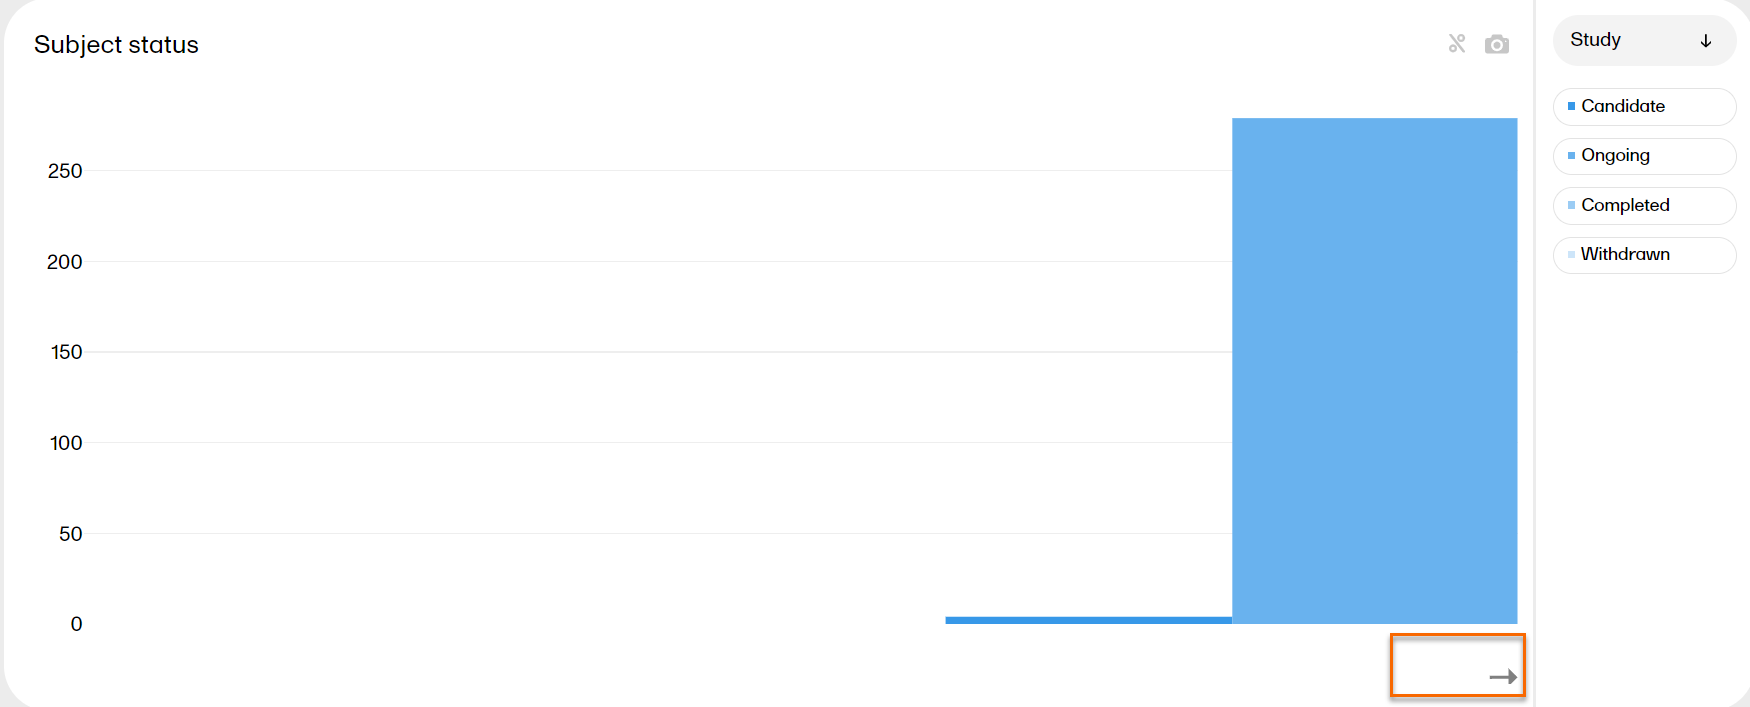
|
There is a specific Dashboard page for Japanese PMS studies in Viedoc Reports.
When launching Viedoc Reports, you land on the Dashboard page. This page shows summaries of the whole study with high-level plots to quickly get an overview of the study status.
You can also see more detailed information by zooming, toggling, hovering, and more. See Tools for more information.
The Dashboard page gives snapshots of the registration and study progress, with data highlighted in different ways and angles. The plots on the page complement each other, and by observing trends from each one, you get a good all-round understanding of the study progress and performance.
1. Study name
2. Page menu - Dashboard (current page), Demographics, Adverse Events, Data Browser, Reports.
3. User name, role, and a dropdown menu with settings to personalize the interface by choosing a color palette, language settings (English), and logout.
4. Registration status
5. Study plan
6. Registration plot
7. Subject status plot
8. Reason for withdrawal plot
9. Booklets initiated plot
On top of the dashboard, you find a bar with four boxes reflecting the registration status:
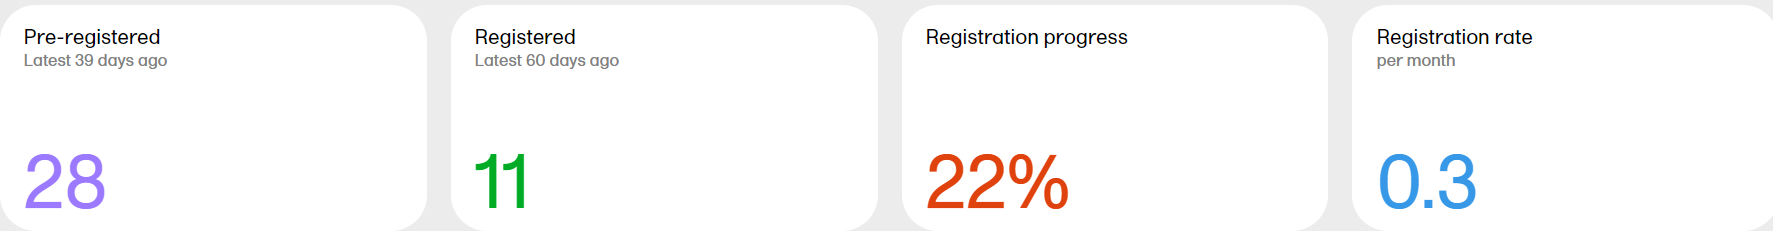
Pre-registered - the total number of pre-registered subjects* and the number of days since the latest pre-registration.
Registered - the total number of registered subjects* and the number of days since the latest registration.
Registration progress - the actual number of registered subjects divided by the expected number of registered subjects. The expected number of registered subjects is taken from what has been set in Viedoc Admin by the Study Manager. The value can go above 100% if the sites register more than the expected number of subjects.
Registration rate - the speed at which the subjects are being registered across the sites. Until the study is 11 weeks from FSFB (first subject first booklet), the rate is displayed as number of subjects/week. After 11 weeks, the rate is displayed as number of subjects/month. The blue line is a snapshot of the latest 11 weeks/months, giving a visual cue of the registration trend.
Note! A subject is pre-registered when the registration booklet has been completed and submitted.
*as per the definition in Viedoc Designer.
The Study plan shows the registration progress and contains markers with completed and predicted milestones. The Study plan serves as a forecast for when the study can be expected to reach these milestones.
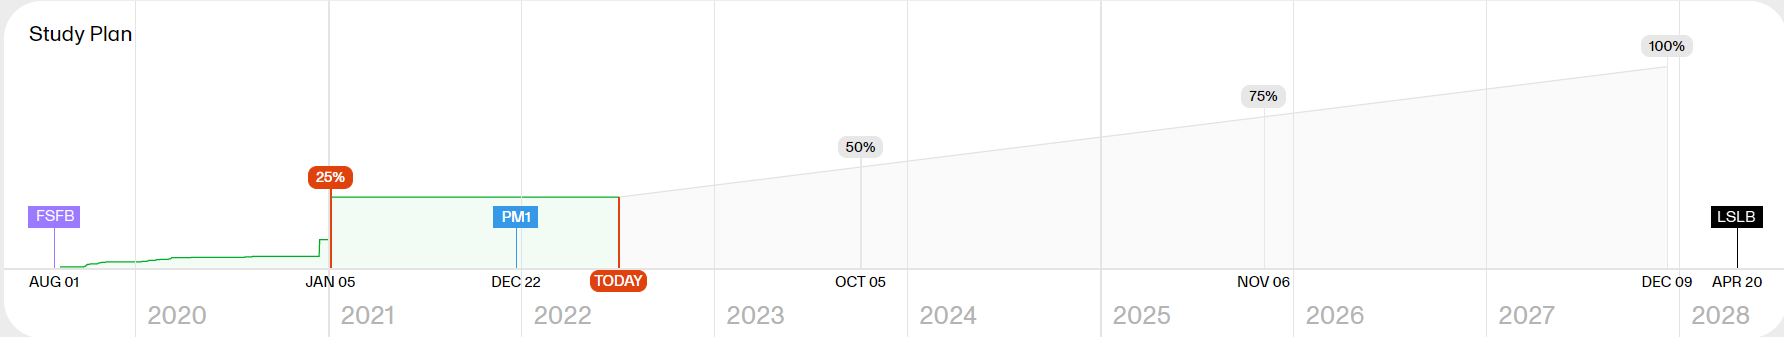
Note! As the Study plan needs data from the study to be generated, it is visible when 5% of the registration has occurred and is then continuously shaped by the performance data.
The Study plan shows the following markers:
Tip! You can hover over a marker in the Study plan to see more details.
The green part represents the actual registration so far. From the study settings, we know the Expected Registration for the study. Based on these two data points, along with the total number of days it took to register so far, the remaining milestones are extrapolated.
For example:
Expected registration for the study as per study settings = 300 subjects
Actual registration so far = 60 subjects
Total number of days so far since the first registration = 120 days
% of registration completed so far = 60/300 = 20%
So, the extrapolations are as below:
Actual: 20% of registration took 120 days
Estimate: 25% of registration will take (25 * 120)/20 = 150 days
Estimate: 50% of registration will take (50 * 120)/20 = 300 days
Estimate: 75% of registration will take (75 * 120)/20 = 450 days
Estimate: 100% of registration will take (100 * 120)/20 = 600 days
This estimate along with the user-provided Expected Registration Completion Date (provided via study settings) represented in study plan via the PM1 marker will help you to understand whether the current rate of registration is sufficient to reach the target.
The Registration plot shows the number of pre-registered and registered subjects over time. You can select to view the plot sorted per Study, Country or Site, by clicking the dropdown menu to the right.
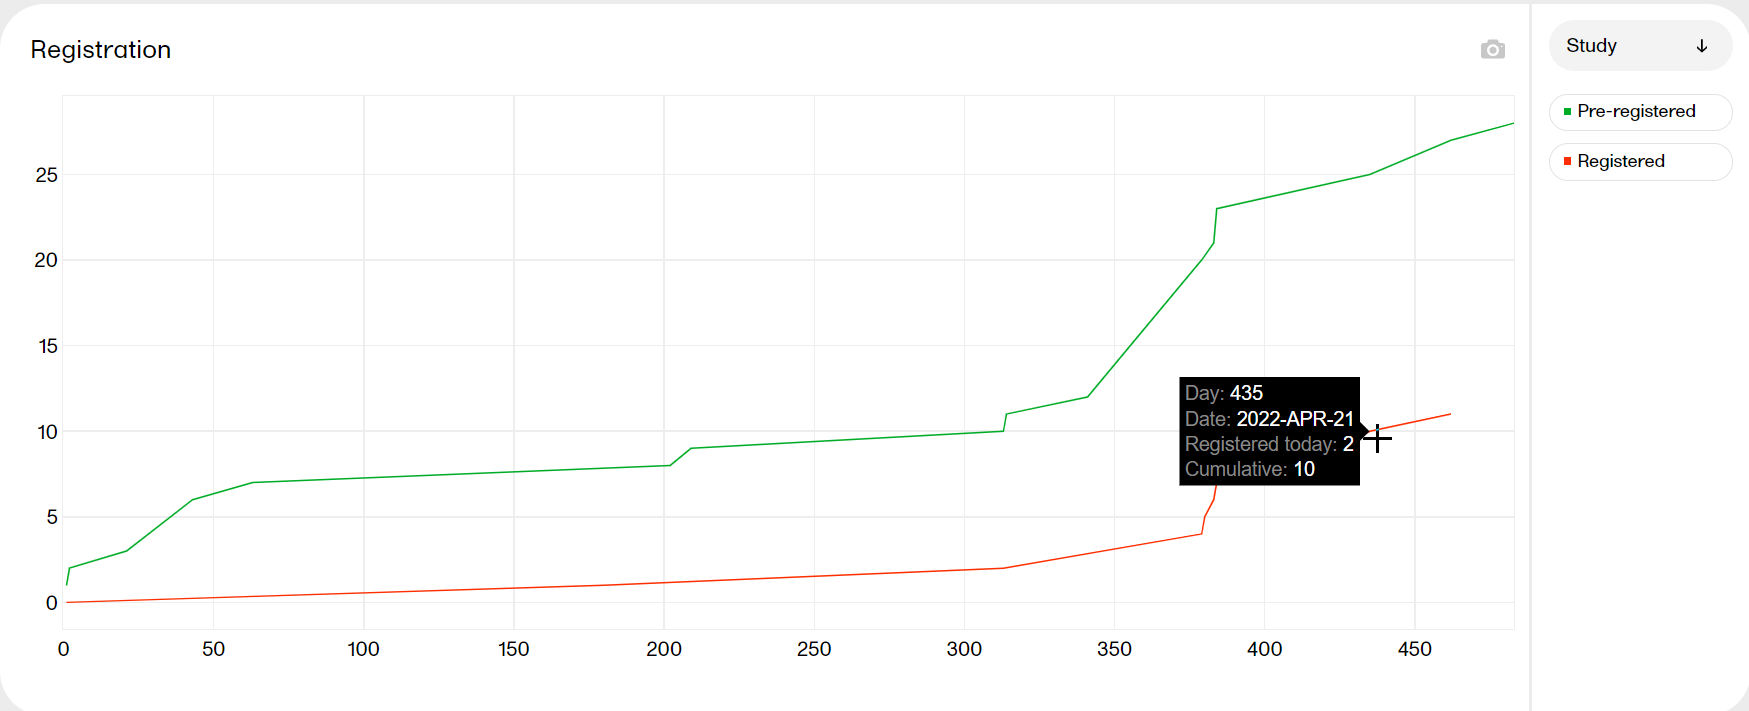
Hover over a graph at any given point to show the following information:
Day: the day of the point (day 1 is FSFB)
Date: the date of the point
Pre-registered/registered today: the number of pre-registered/registered subjects at this date
Cumulative: the number of pre-registered/registered subjects up to this point in time
| Zoom | Click and drag in any given area to zoom in. Double-click to zoom out. |
| Hide | Click a title in the legend to hide the graph in the plot. Click again to make it re-appear. |
| Download | Click the camera symbol to take a snapshot of the plot. A .png file will be downloaded to your computer. |
| Scale | Hover over the axis to make a double arrow appear. Then click and drag the arrows to scale the axis. A blue arrow indicates that there are more bars out of view on the X-axis. |
The Subject status plot shows the subject status distribution in the study, sorted by:
* as per the definition in Viedoc Designer.
You can select to view the plot sorted per Study or Site, by clicking the dropdown menu to the right.
|
Zoom |
Click and drag in any given area to zoom in. Double-click to zoom out. |
| Hide | Click a title in the legend to hide the graph in the plot. Click again to make it re-appear. |
| Download | Click the camera symbol to take a snapshot of the plot. A .png file will be downloaded to your computer. |
| Toggle | Click the % symbol to toggle the graph to a view with a 100% stacked bar. Click again to go back to the previous view. Toggling the bars shows the relationship between them, visualized on top of each other instead of side by side. |
| Scale | Hover over the axis to make a double arrow appear. Then click and drag the arrows to scale the axis. A blue arrow indicates that there are more bars out of view on the X-axis. |
The Reason for withdrawal plot shows the distribution of reasons for withdrawal from the study. MULTIPLE indicates that there are several reasons for the withdrawal of the subject.
Hover over a slice to display the exact number of subjects and the percentage of total subjects.
| Hide | Click a title in the legend to hide the graph in the plot. Click again to make it re-appear. |
| Download | Click the camera symbol to take a snapshot of the plot. A .png file will be downloaded to your computer. |
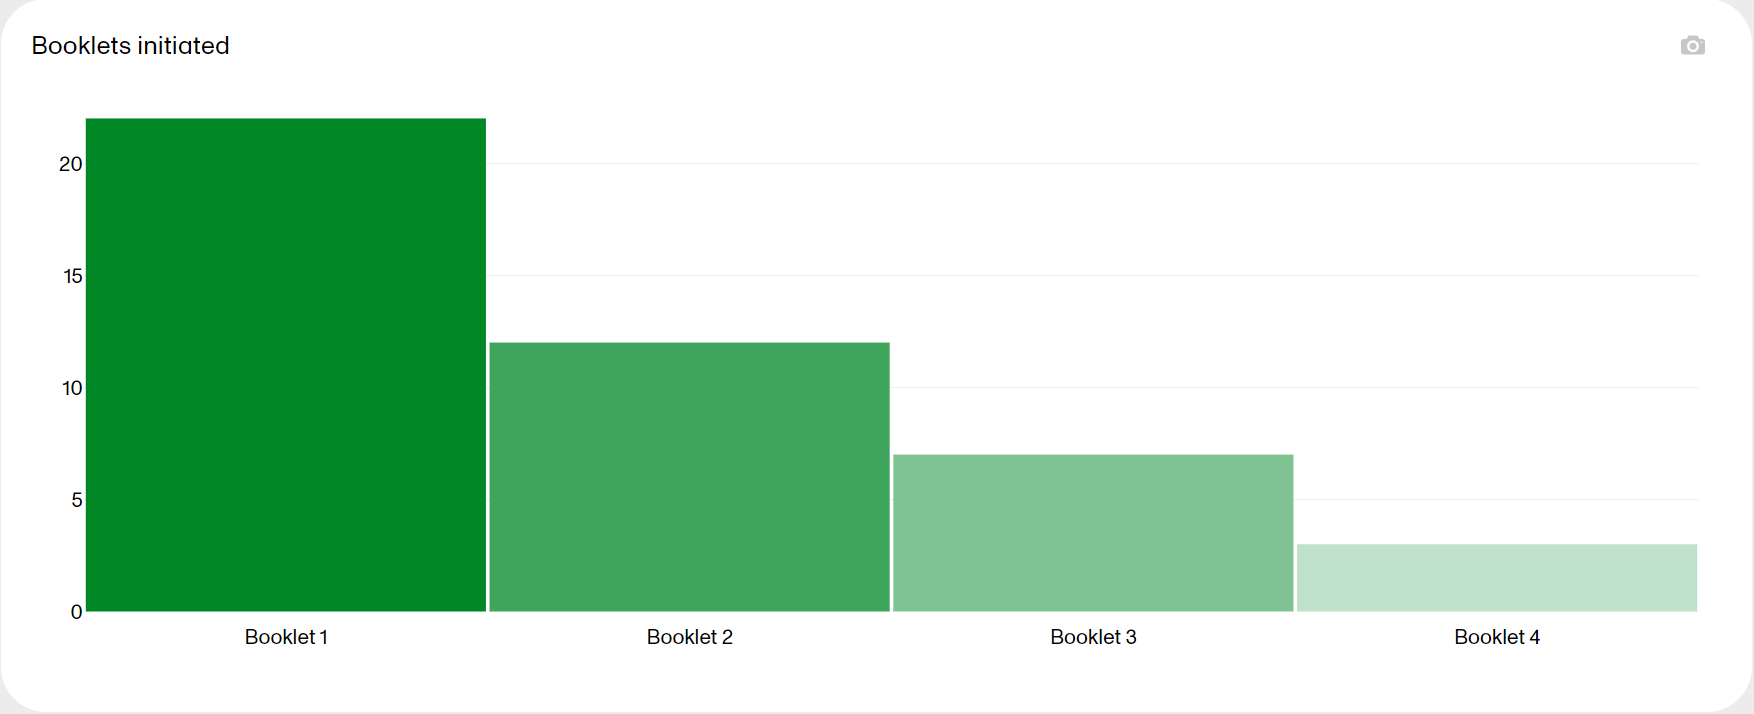
The Booklets initiated plot shows the number of booklets initiated in the study. Hover over a bar to display the exact number of subjects initiated for each booklet.
| Zoom | Click and drag in any given area to zoom in. Double-click to zoom out. |
| Download | Click the camera symbol to take a snapshot of the plot. A .png file will be downloaded to your computer. |
| Scale | Hover over the axis to make a double arrow appear. Then click and drag the arrows to scale the axis. A blue arrow indicates that there are more bars out of view on the X-axis. |
| Zoom |
Click and drag in any given area to zoom in. Double-click to zoom out. 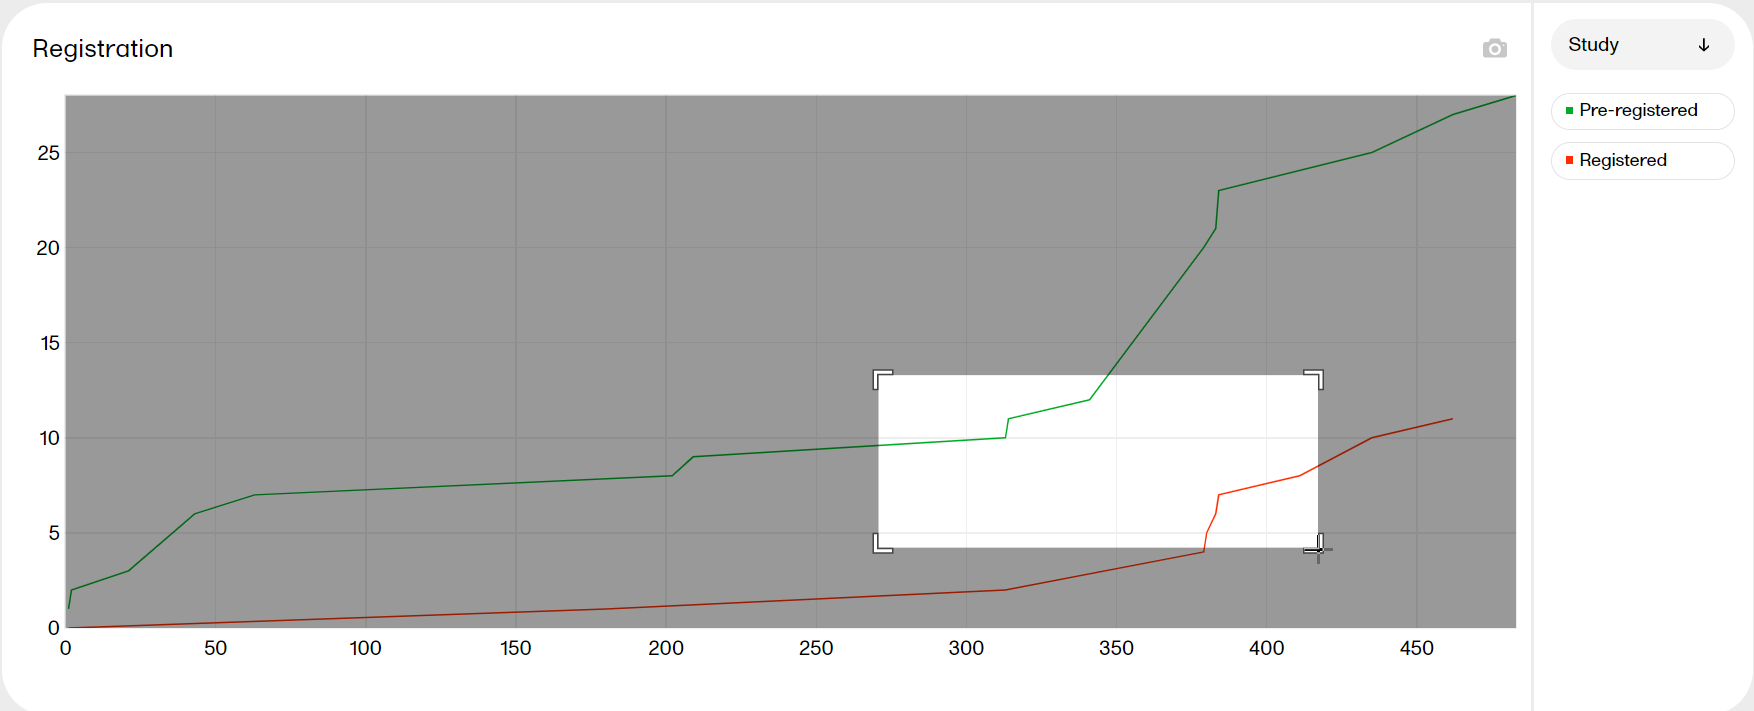
|
| Hide |
Click a title in the legend to hide the graph. Click again to make it re-appear. 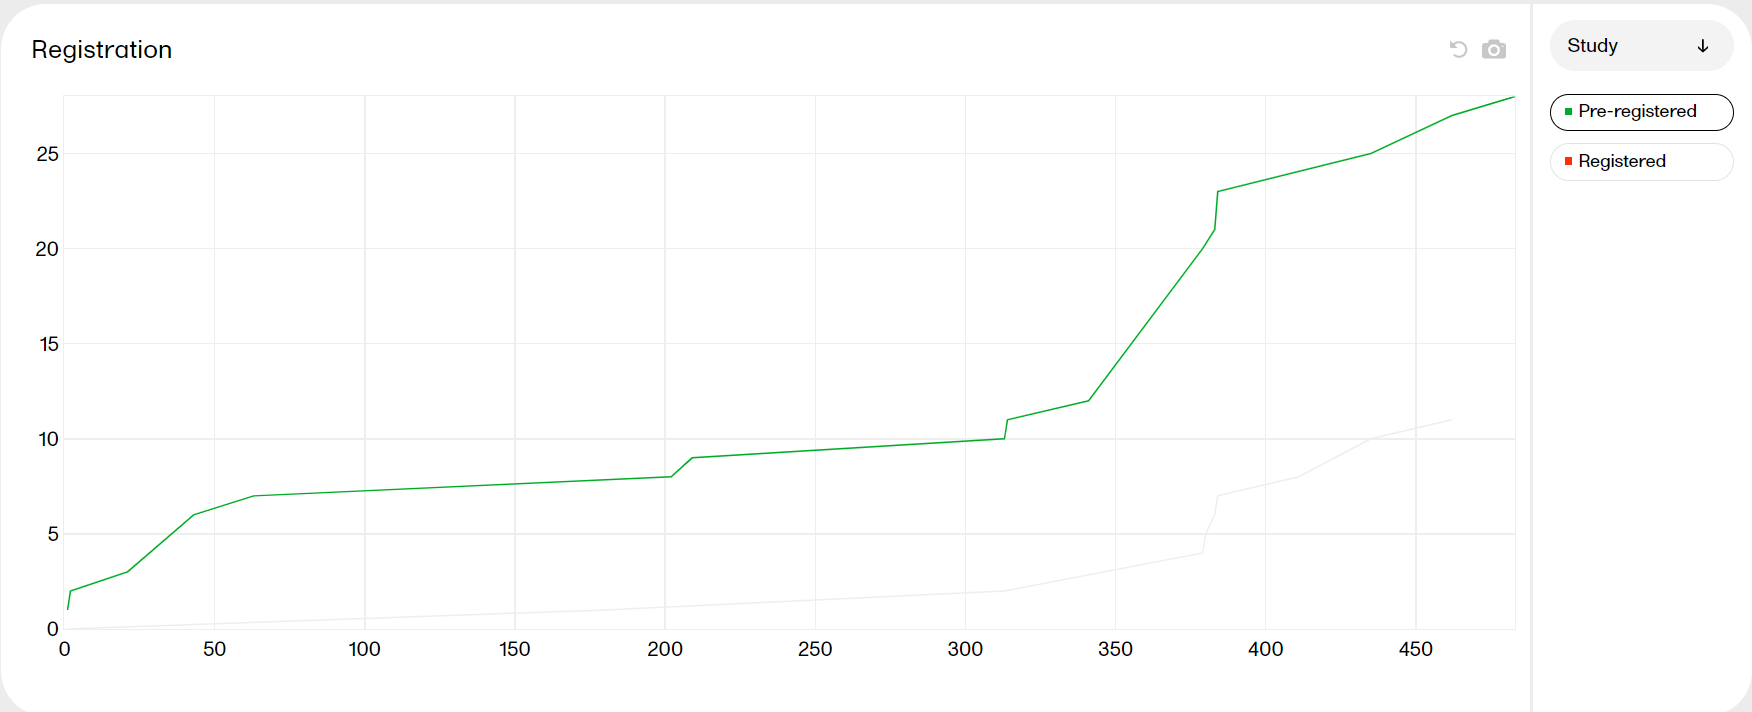
|
| Download |
Click the camera symbol to take a snapshot of the plot. A png file will be downloaded to your computer. 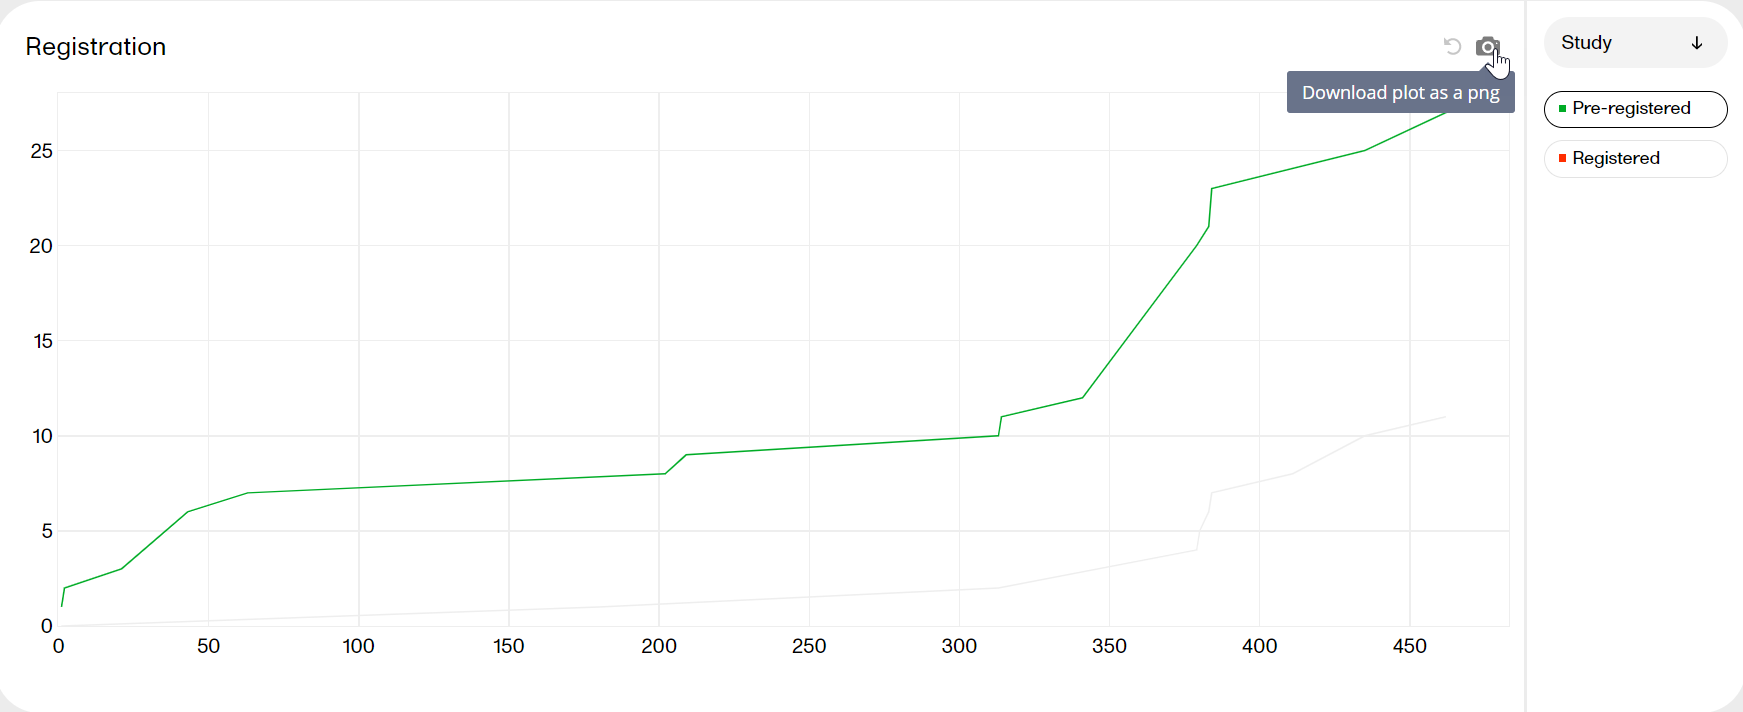
|
| Toggle |
Click the 
|
| Scale |
Hover over the axis to make a double arrow appear. Then click and drag the arrows to scale the axis. A grey arrow indicates that there are more bars out of view on the X-axis. 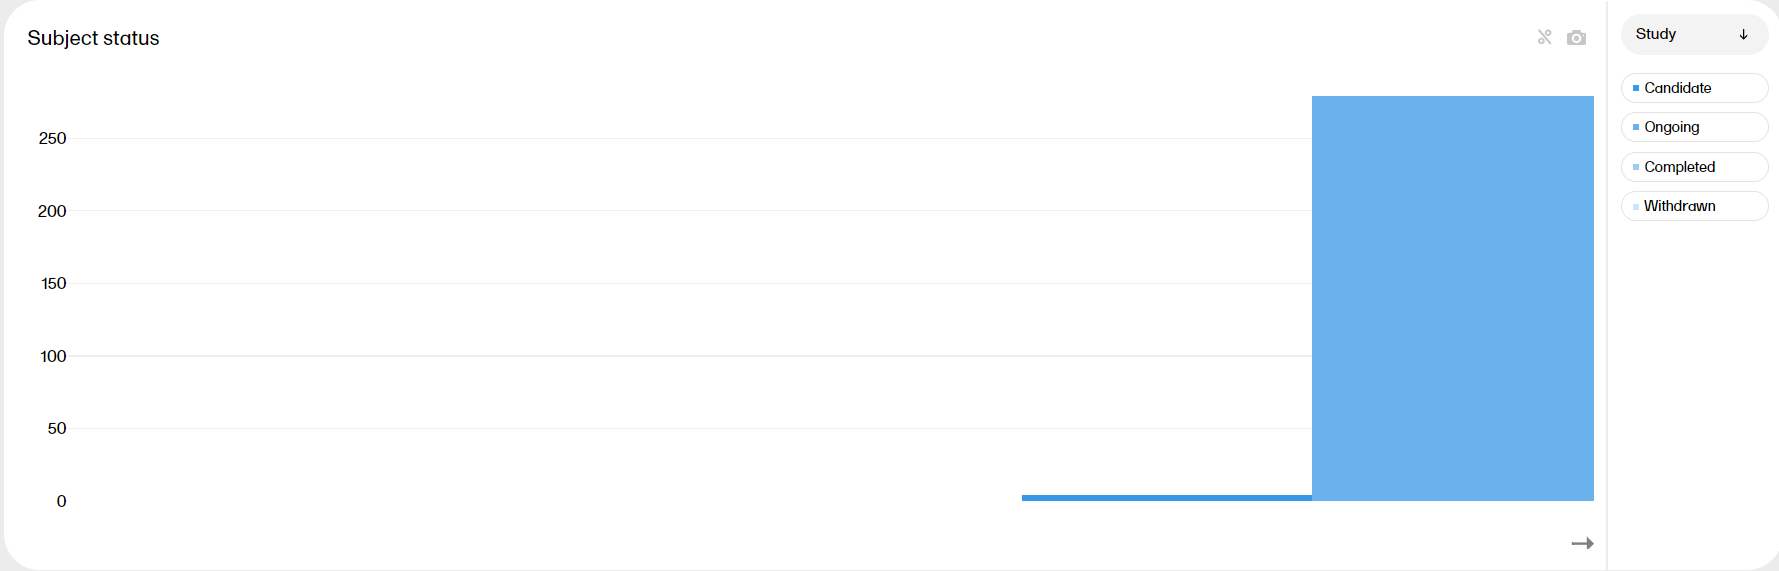
|
The Demographics page provides metrics of the collected data in the study. Here you can see up to six plots, with distribution on different variables according to your study design. The last plot shows the number of subjects per site.
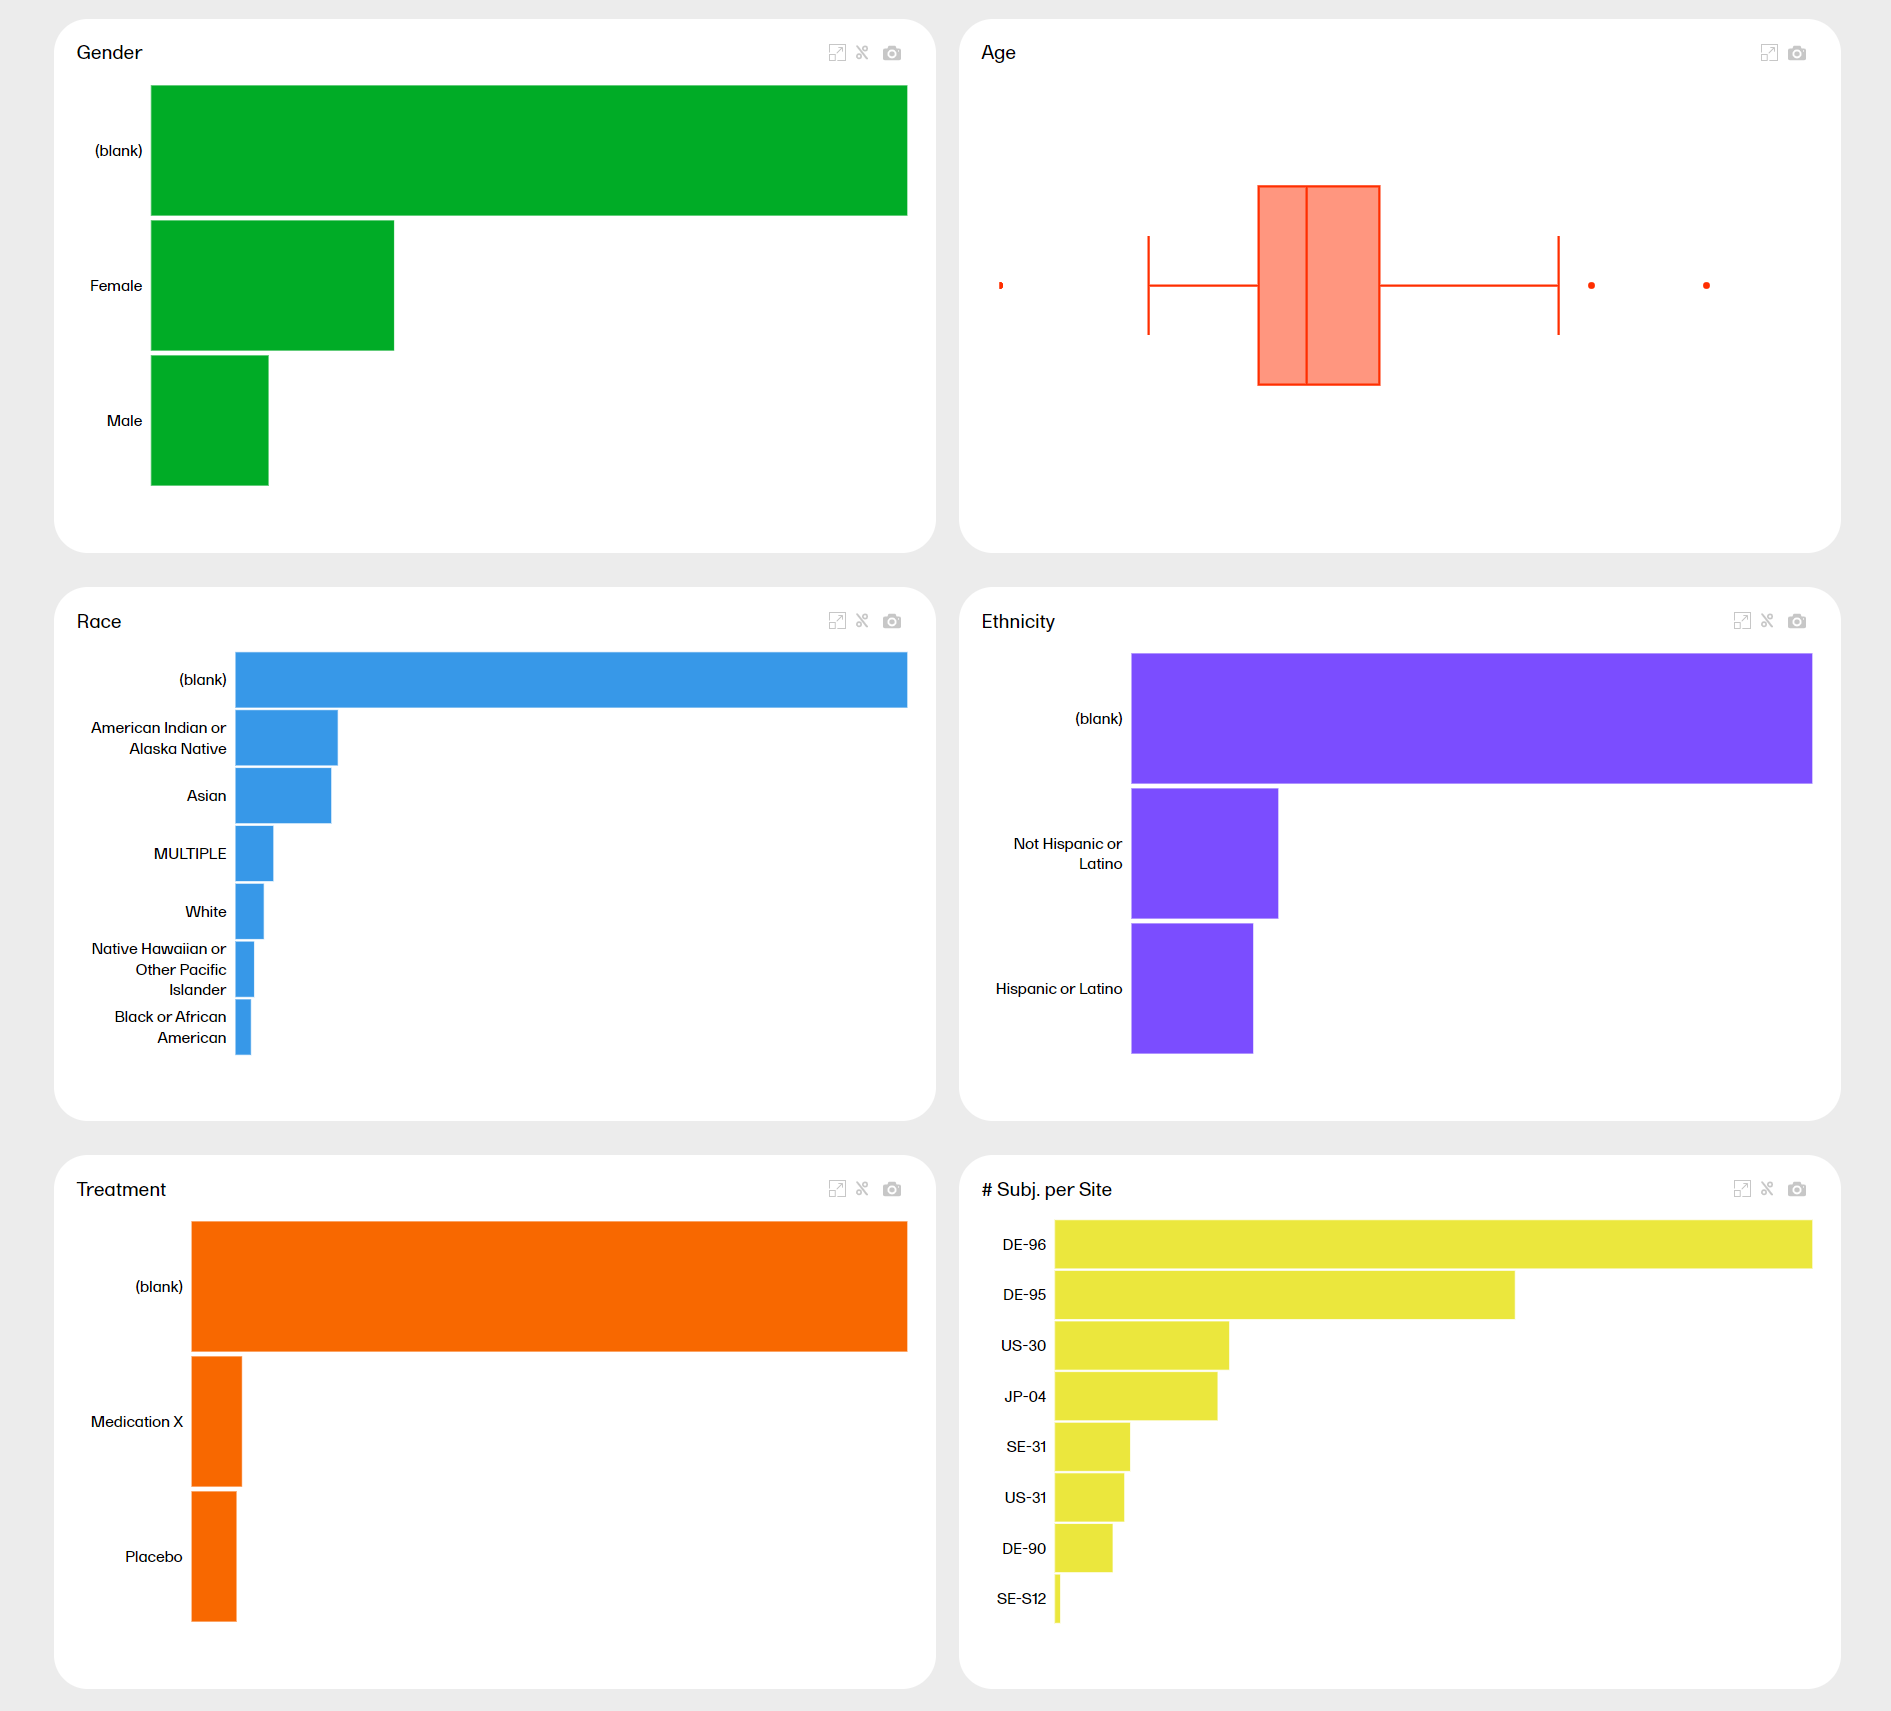
You can hover over a bar to see the exact value: Non-numeric variables
| Zoom | Press and drag at any given area to zoom it in. Double-click to zoom out. |
| Download | Click the  symbol to take a snapshot of the plot. A .png file will be downloaded to your computer. symbol to take a snapshot of the plot. A .png file will be downloaded to your computer. |
| Toggle | Click the  symbol to toggle the graph with 100% stacked bar. Click again to go back to the previous view. Toggling the bars shows the relationship between them, visualized on top of each other instead of side by side. symbol to toggle the graph with 100% stacked bar. Click again to go back to the previous view. Toggling the bars shows the relationship between them, visualized on top of each other instead of side by side. |
| Scale | Hover over the axis to make a double arrow appear. Then click and drag the arrows to scale the axis. |
| Expand | Click the  symbol to expand the plot into a new window and see more details. symbol to expand the plot into a new window and see more details. |
You can see more information about the tools here.
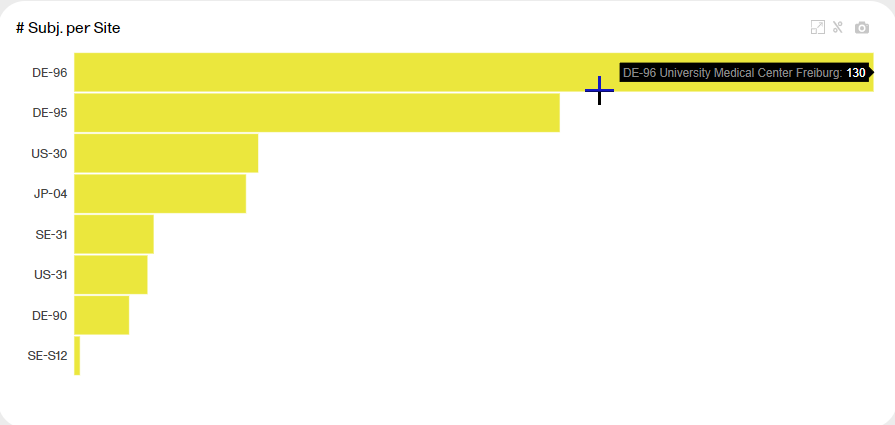
The last plot shows the number of subjects per site. Each bar reflects a site, identified with the site ID.
Hover over a bar to display the site ID, the site name, and the number of subjects at the site.
You can click on one of the variables to arrange all other plots according to this variable. The variable must be non-numeric. Simply click on the plot you're interested in. For example, clicking the Gender plot arranges all plots by that variable:
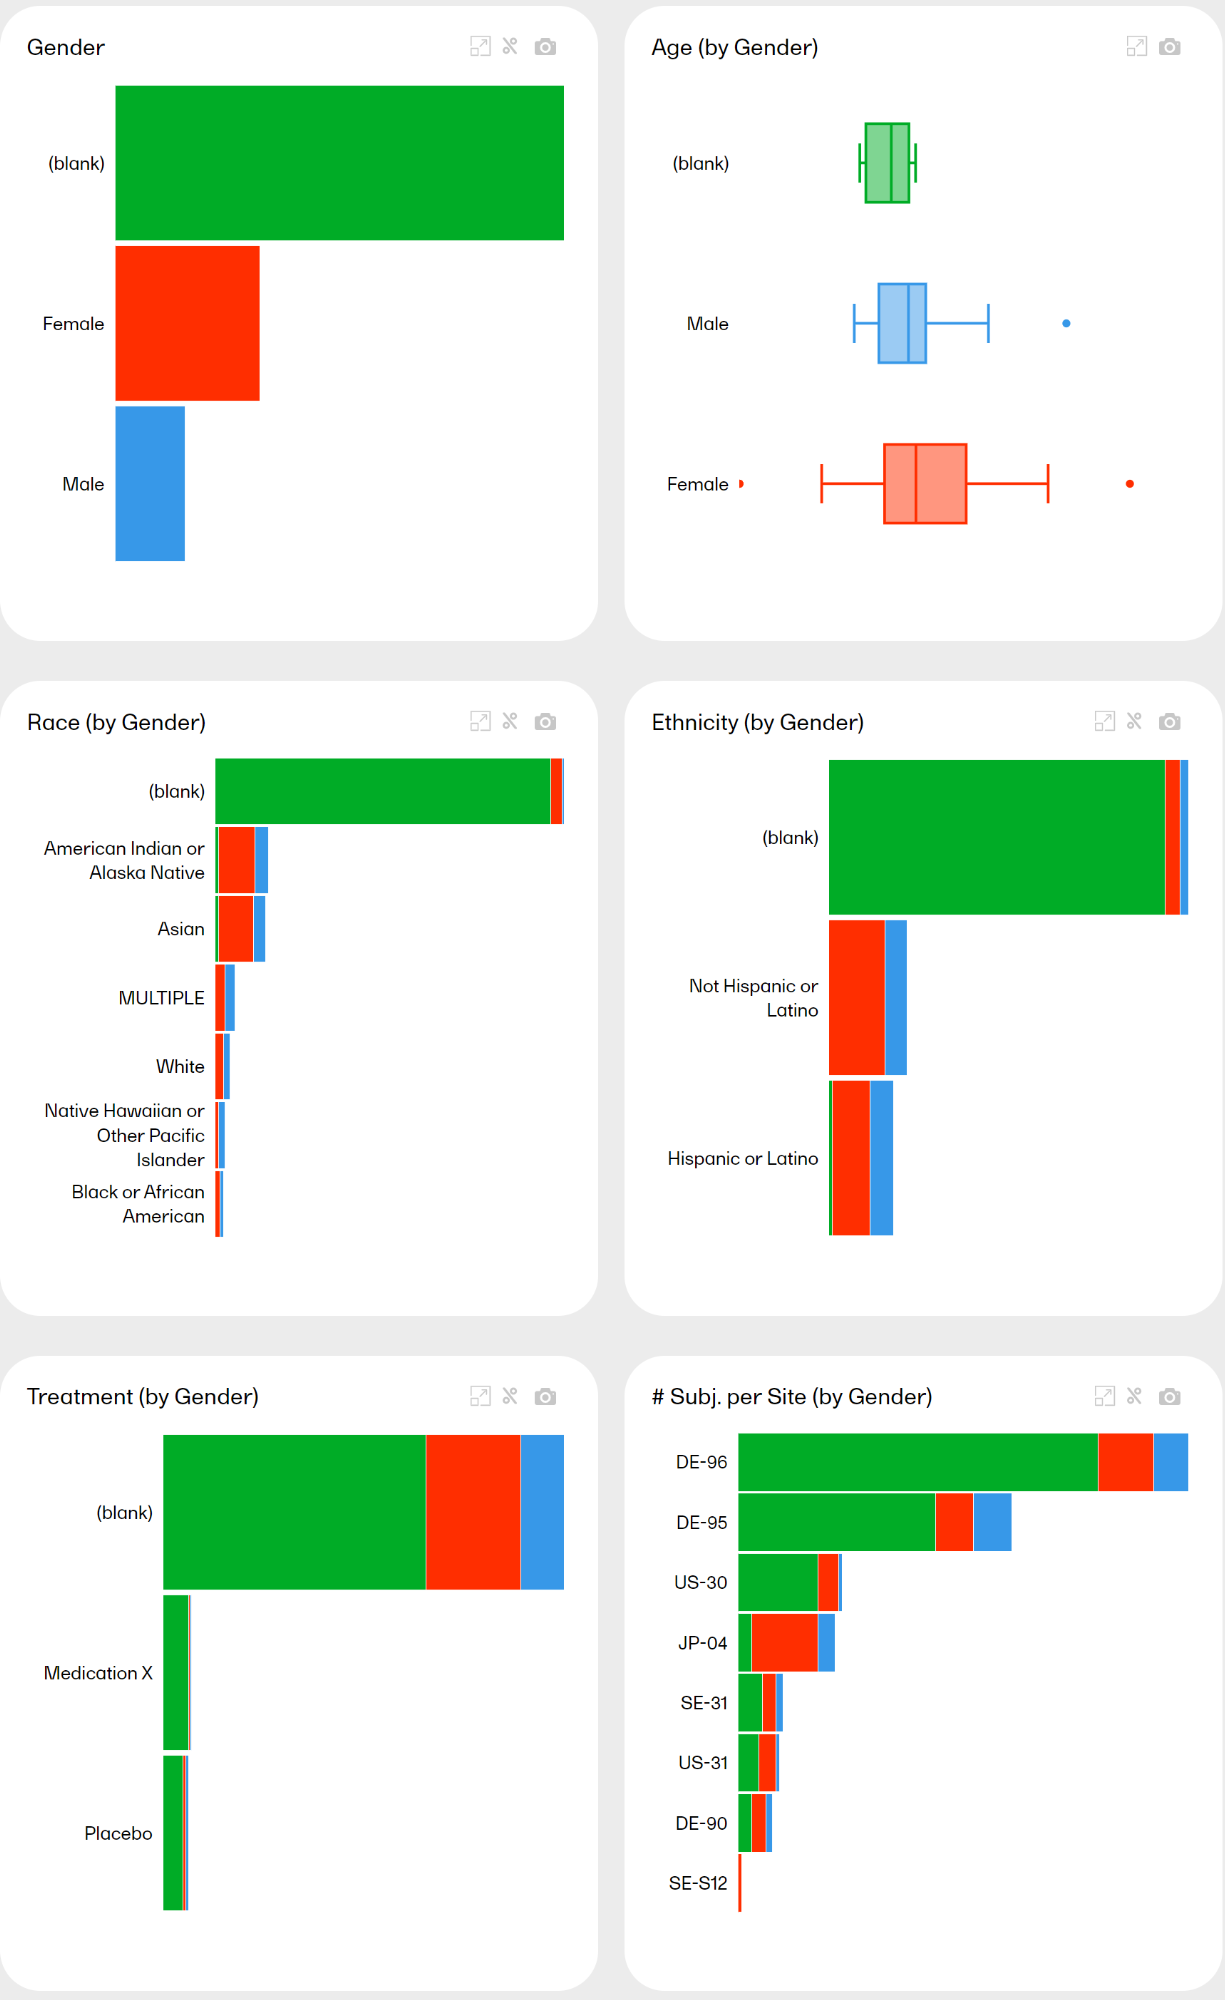
Note! All plot titles are renamed with the additional by Sex. Click again on the same plot to go back to the previous view, or click on another plot to arrange all other plots accordingly.
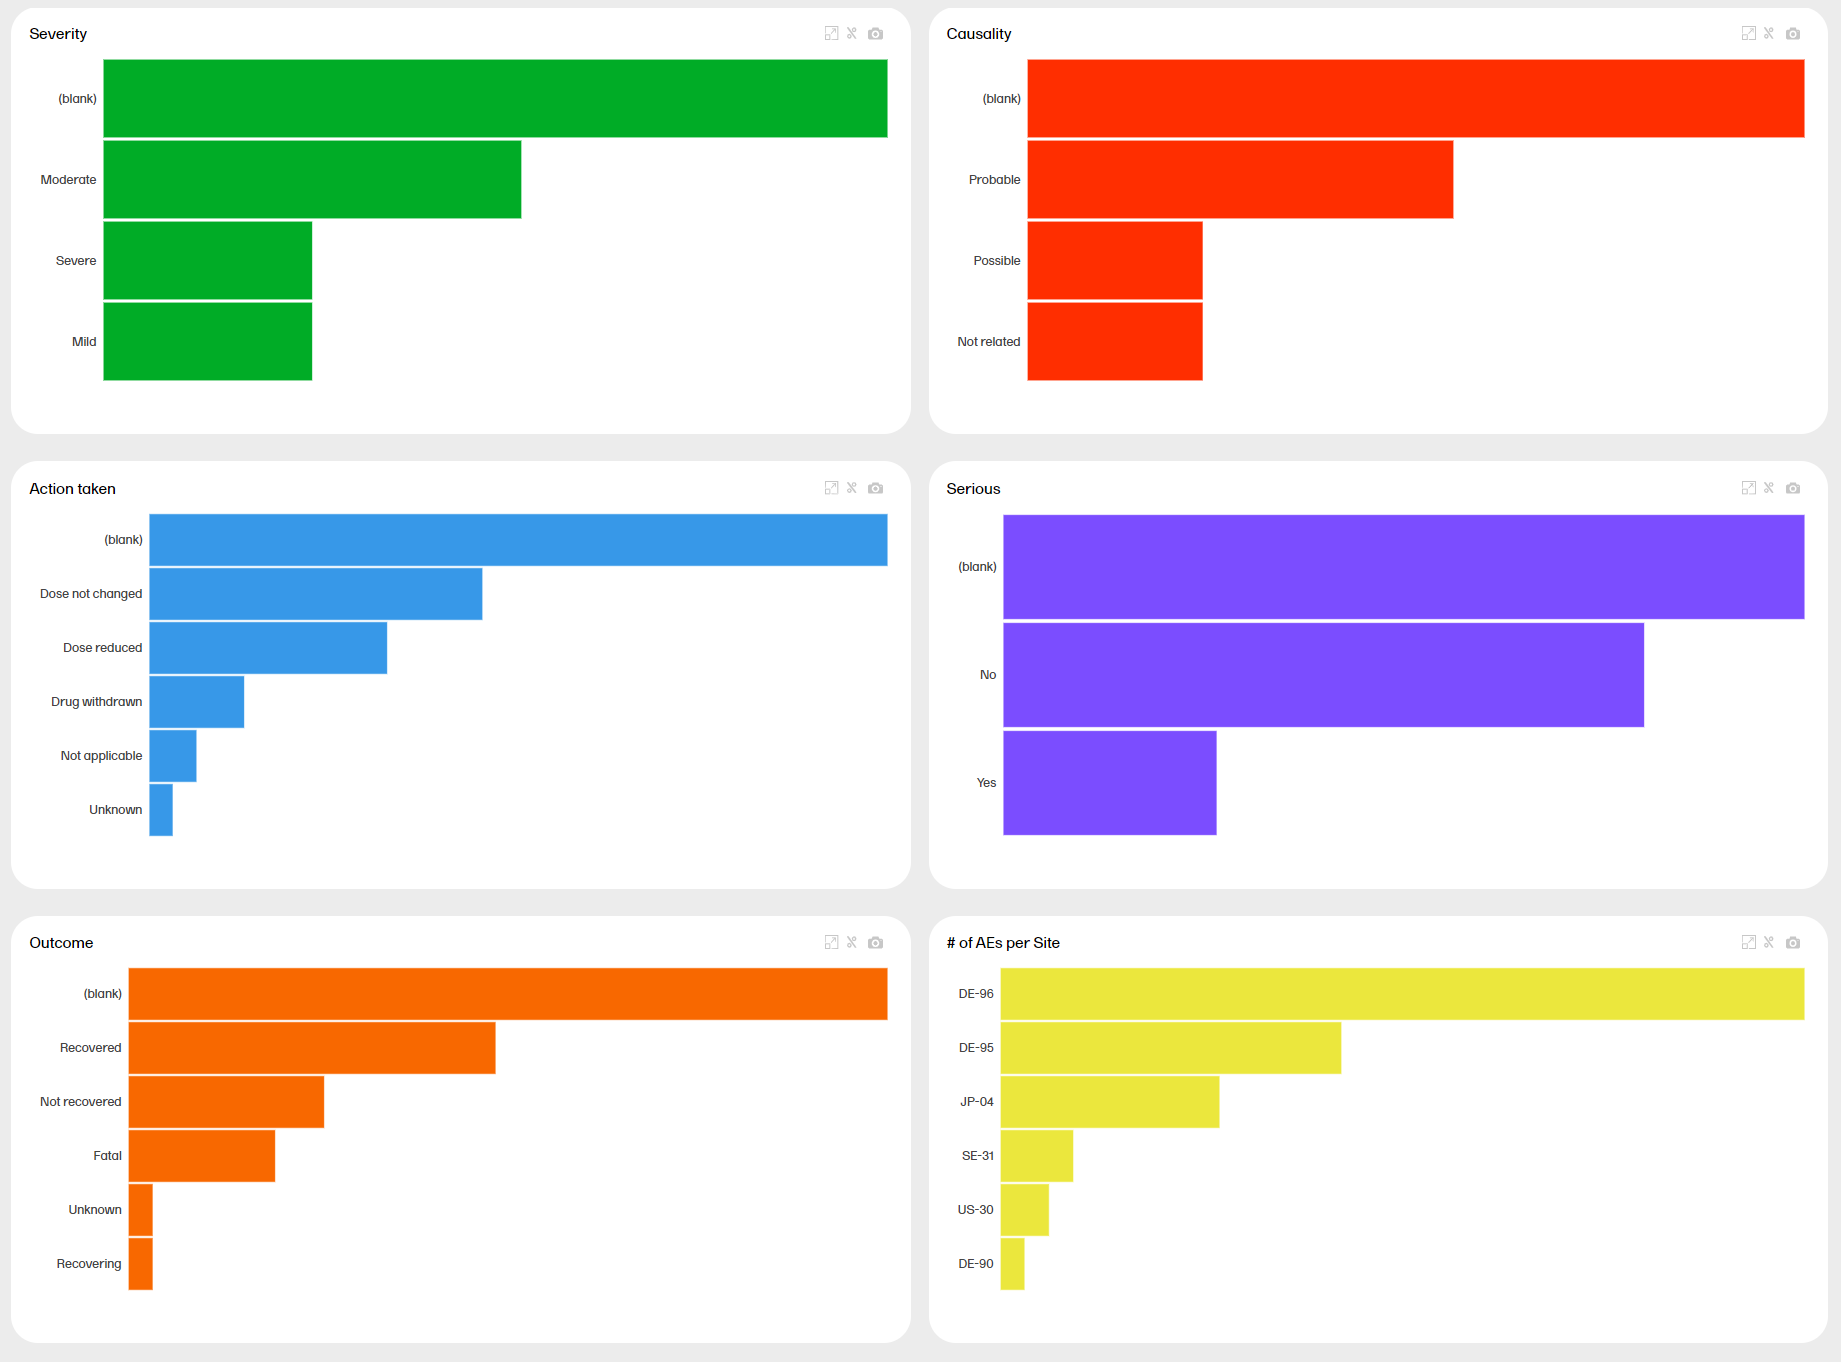
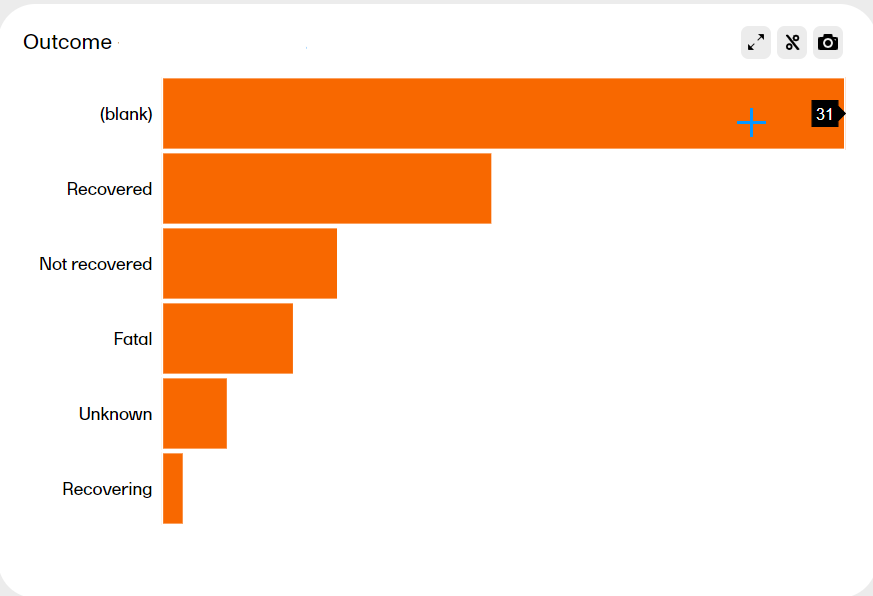
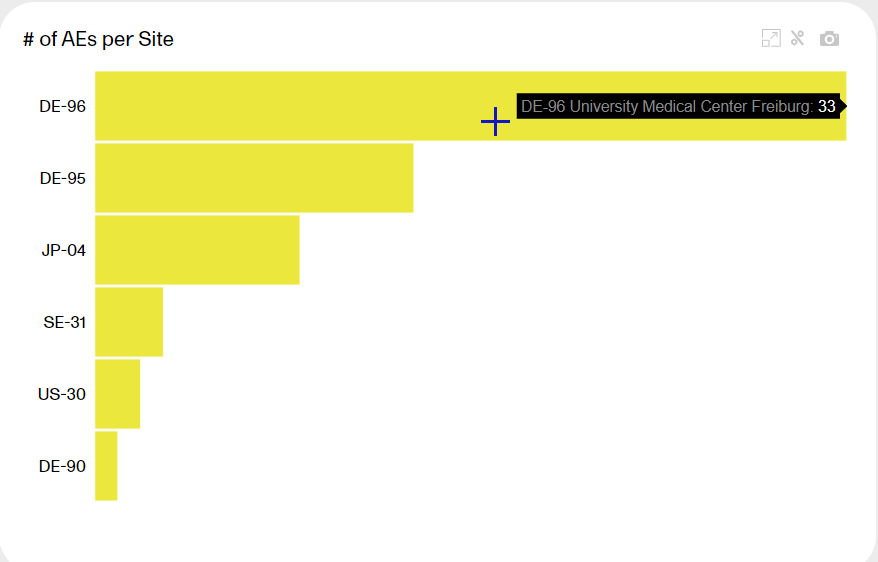
The Adverse Events page provides metrics over the adverse events (AE) in the study. Here you can see up to six plots with distribution on different variables according to your study design. The last plot shows the number of AE per site.
You can hover over a bar to see the exact value:
| Zoom | Press and drag at any given area to zoom it in. Double-click to zoom out. |
| Download | Click the  symbol to take a snapshot of the plot. A .png file will be downloaded to your computer. symbol to take a snapshot of the plot. A .png file will be downloaded to your computer. |
| Toggle | Click the  symbol to toggle the graph with 100% stacked bar. Click again to go back to the previous view. Toggling the bars shows the relationship between them, visualized on top of each other instead of side by side. symbol to toggle the graph with 100% stacked bar. Click again to go back to the previous view. Toggling the bars shows the relationship between them, visualized on top of each other instead of side by side. |
| Scale | Hover over the axis to make a double arrow appear. Then click and drag the arrows to scale the axis. |
| Expand | Click the  symbol to expand the plot into a new window and see more details. symbol to expand the plot into a new window and see more details.
 |
You can see more information about the tools here.
The last plot shows the number of AE per site. Each bar reflects a site, identified with the site ID.
Hover over a bar to display the site ID, the site name, and the number of AE at the site.
You can click on one of the variables to arrange all other plots according to this variable. The variable must be non-numeric. Simply click on the plot you're interested in. For example, clicking the Serious plot arranges all plots by this variable:
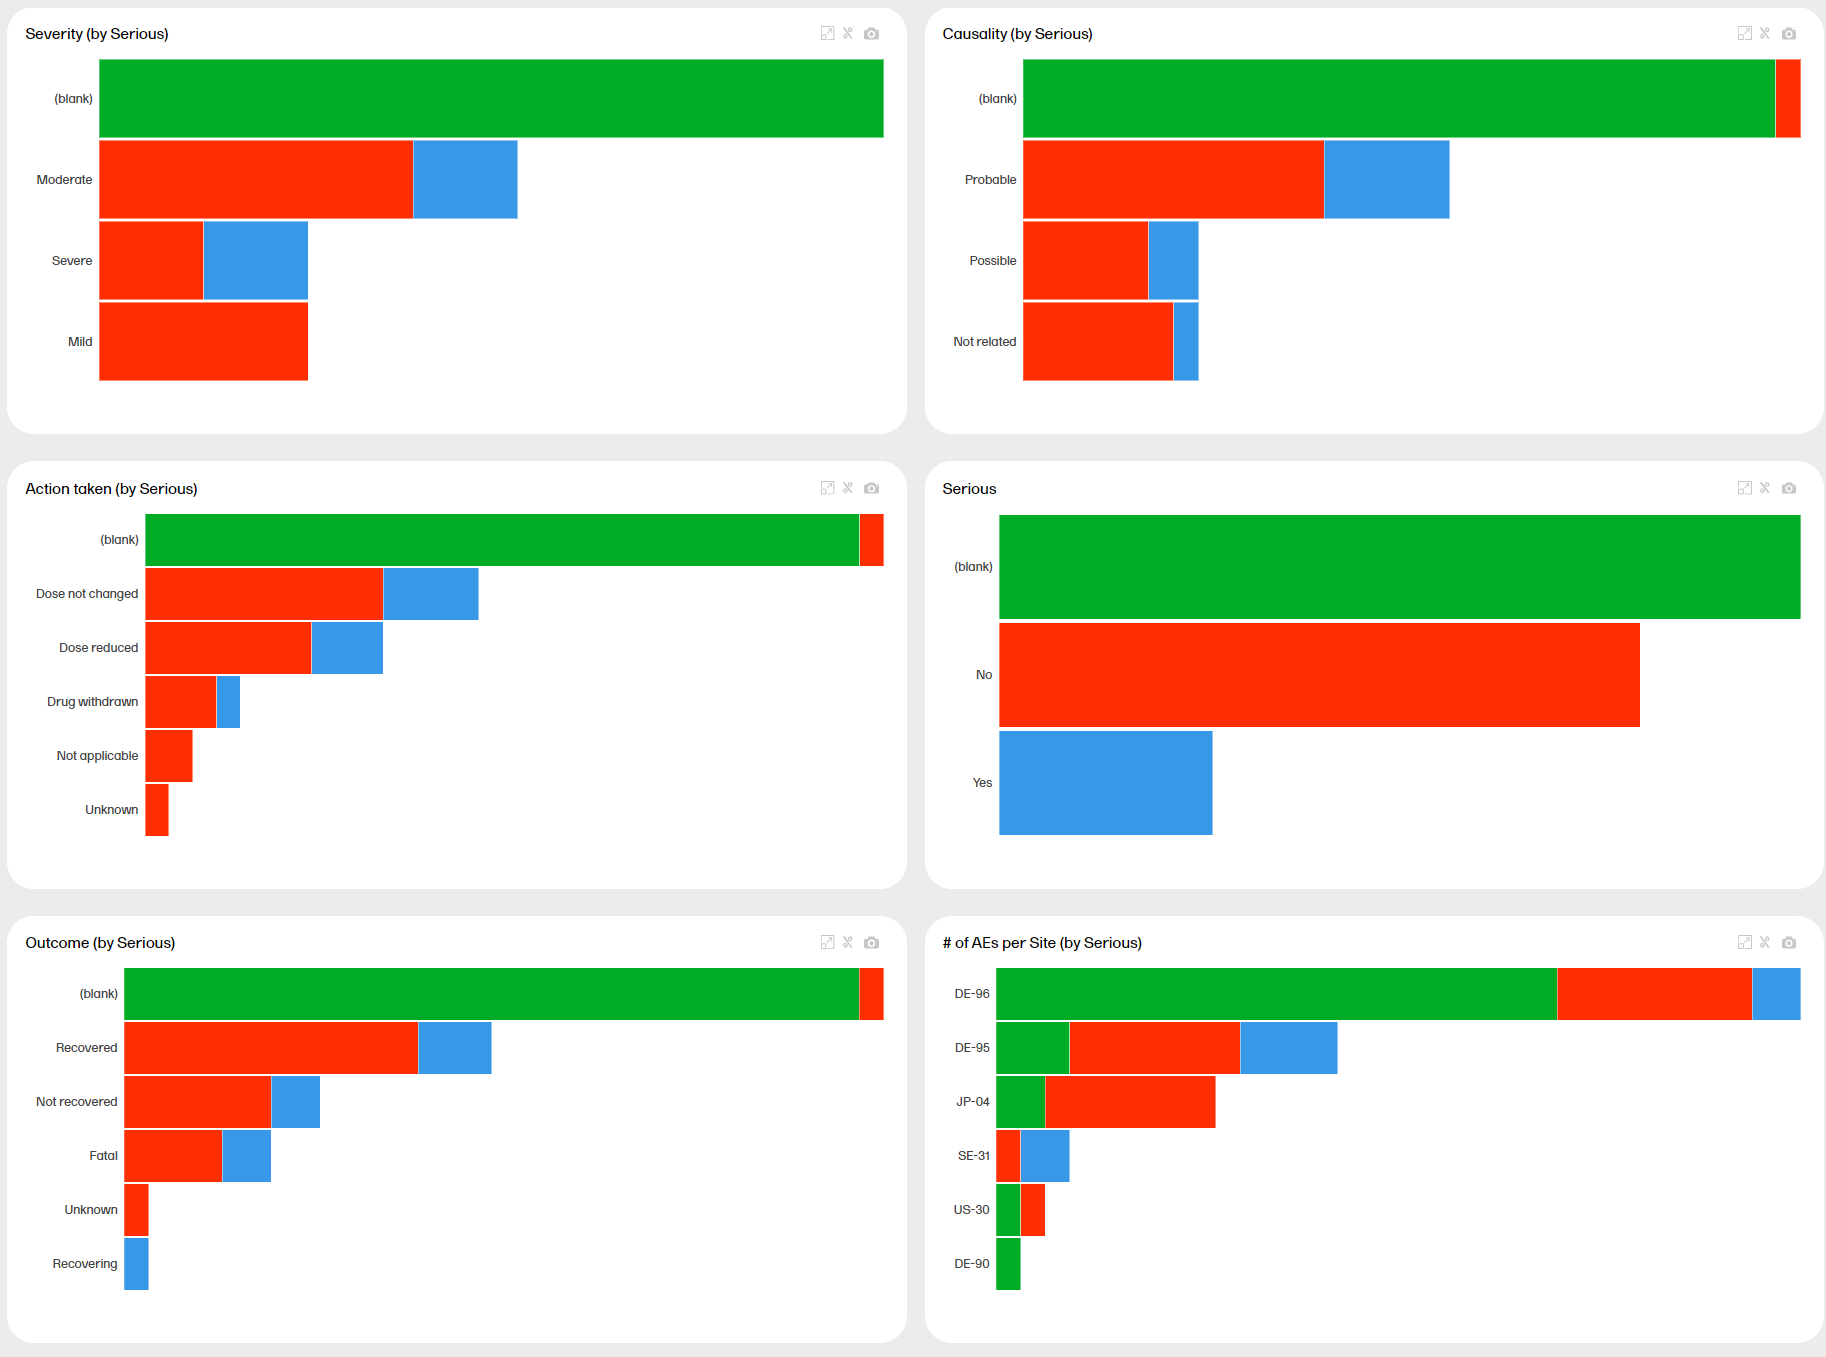
Note that all plot titles are renamed with the additional title (by Serious). Click again on the same plot to go back to the previous view, or click on another plot to arrange all other plots accordingly.
In the Data Browser page, you can browse all your forms and see data from all subjects in a table. Here you can sort, search, filter, cross-check, and download data, as described below.
Note! The forms and fields visible in the Data browser are determined by the visibility settings for your user role.
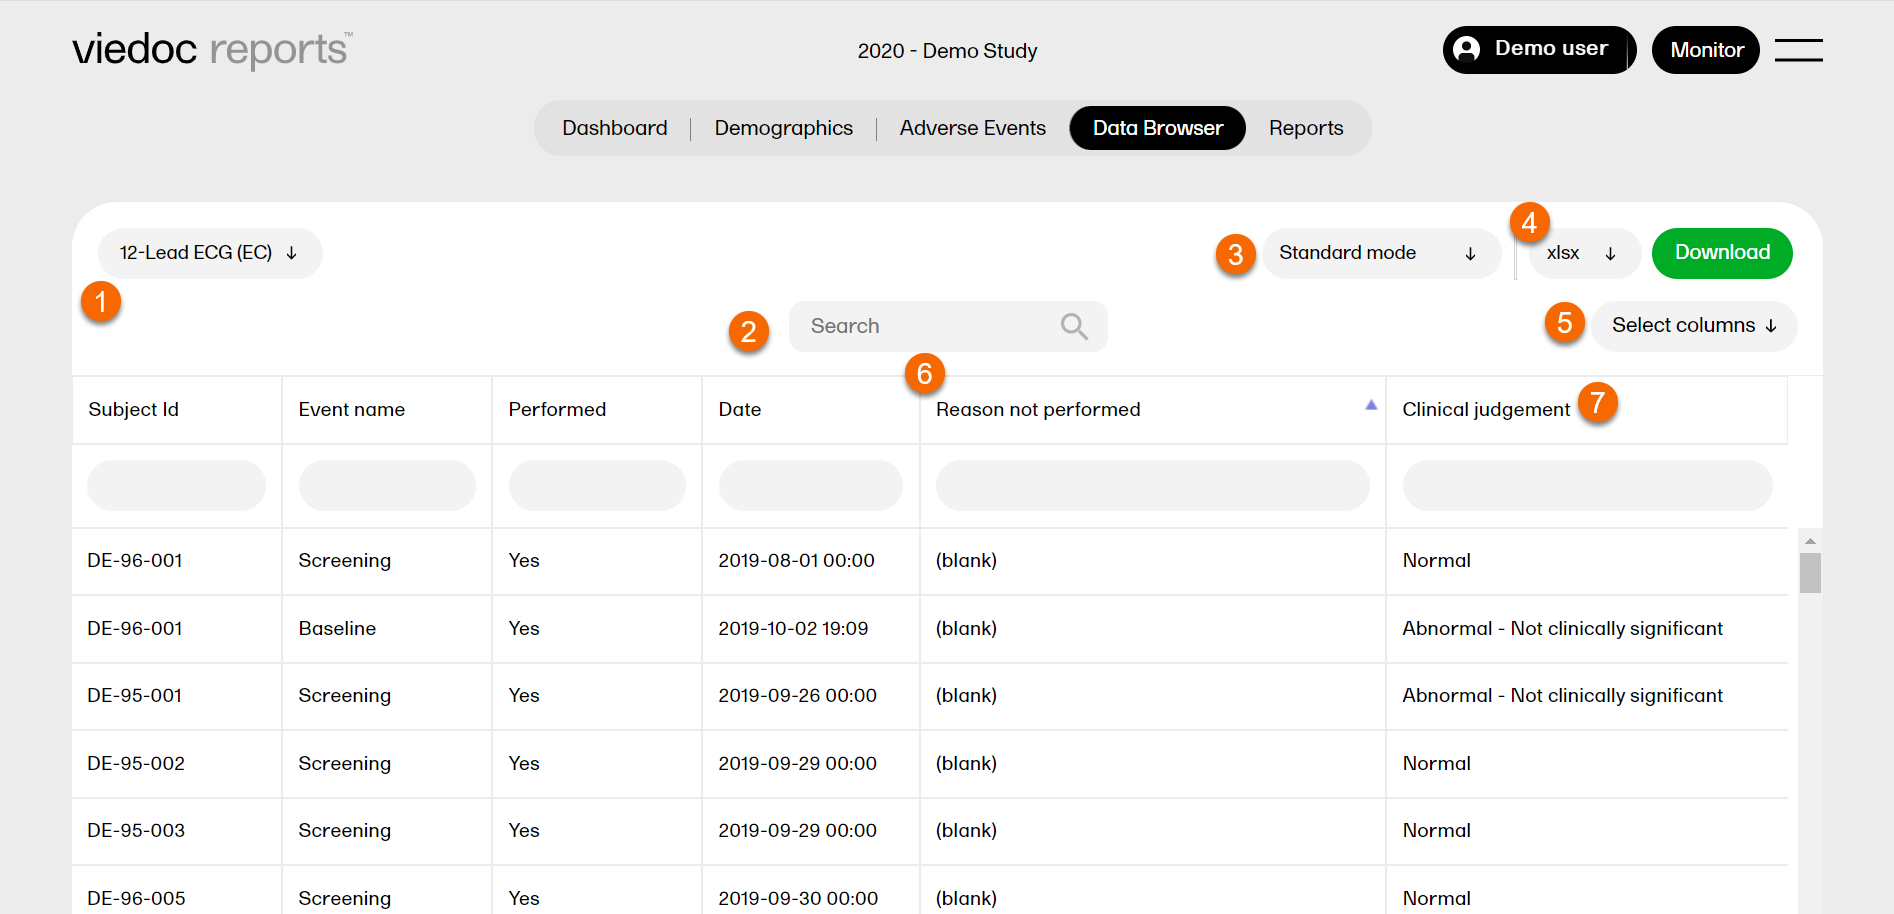
1. Select a form in the dropdown list.
2. Search the entire table for matches containing the word.
3. Select Standard mode or Cross-check mode. For more information, see Comparing two tables.
4. Select a format to download: xlsx / csv / xpt and click Download. For more information, see Downloading browser data.
5. Click Select columns and add or remove columns from the dropdown list. Click anywhere to return.
6. Click a column header to sort the data in ascending order. Click again to sort in descending order.
7. Click any field and select a form item to filter your data on that item. Click the x symbol to reset the filter.
You can download the data in the following formats:
Note!
The structure of the file name is as follows:
[STUDYNAME_FORMNAME (FORMID)_DATE/TIMESTAMP.FORMAT]
[DATE/TIMESTAMP] is in the following structure:
[YYYYMMDDHHMMSS], which is the date and time at which the data was downloaded from Viedoc (through the daily data sync).
Example of a file name: "DemoStudy2020_Demographics(DM)_20200903220345.xlsx"
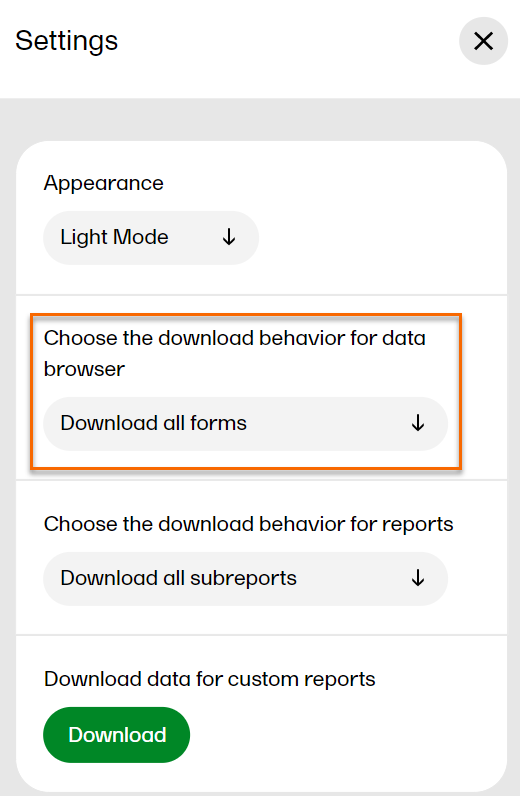
There are two ways of downloading the Case Report Form (CRF) data on the Data Browser page. You can either download the data from the selected CRF or download the data from all CRFs simultaneously.
To download data from a selected CRF:
| 1. |
Select the specific form you want to download from the dropdown menu which displays all the forms used in the study. In the example below, the Adverse Event (AE) form is selected. 
|
| 2. |
In Settings, select Download selected form in the dropdown menu. 
|
| 3. |
1. Select a format to download. 2. Click Download. 
In this example, a file is generated with all registered Adverse Events in the selected file format. Example of a file name: Demo Study_Adverse Event (AE)_202203211243523 |
To download the data from all CRFs simultaneously:
| 1. |
|
| 2. |
1. Select a format to download. 2. Click Download. Note! When the formats xlsx/csv/xpt/xptv8 are selected, a zip file is created. The structure of the file name is as follows: [STUDYNAME_ALL_FORMS_DATE/TIMESTAMP.zip]
Example of a file name: Demo Study_12-Lead ECG (EC)_20220322002931.xlsx
Example of a file name: Demo Study_12-Lead ECG (EC)_20220328230332.rds |
Note! When Download all forms is selected, all the columns of the CRF are downloaded irrespective of the columns chosen in Select columns. When downloading all the CRF data, there is no difference in the downloaded file when selecting Standard mode or Cross-check mode.
If Cross-check mode is enabled at the time of the export, a zip file is created with two files, one for each table.
The structure of the file name is as follows:
[STUDYNAME_Cross-check mode_DATE/TIMESTAMP.zip]. The two files match the file name defined for "Standard mode"
Example of a file name: "DemoStudy2020_Cross-check mode_20200903220345.xlsx"
You can compare two tables by selecting cross-check mode. This gives you an additional table showing up beneath the first one.
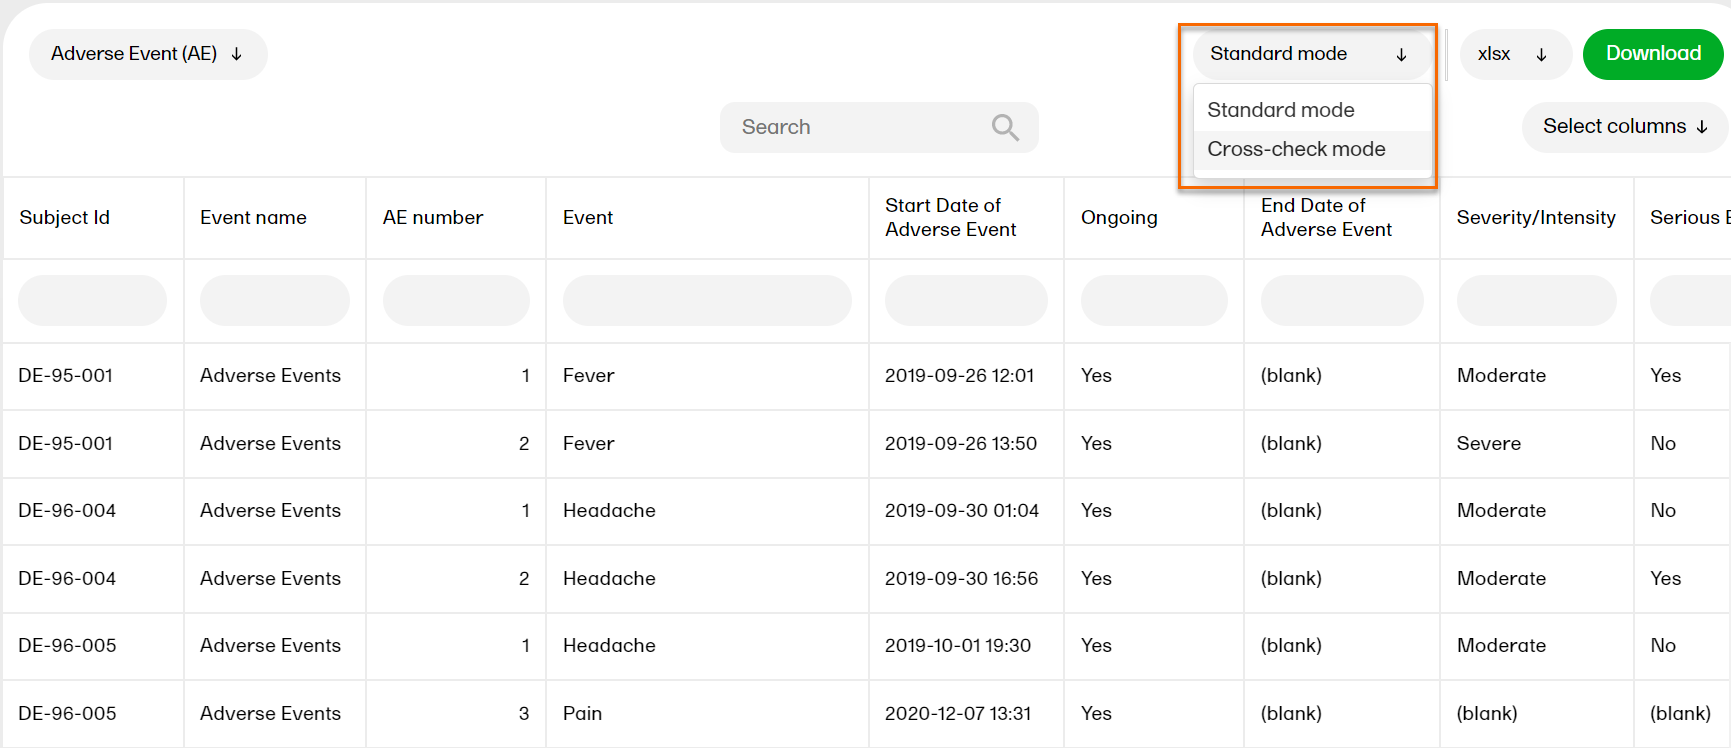
A second tab appears:
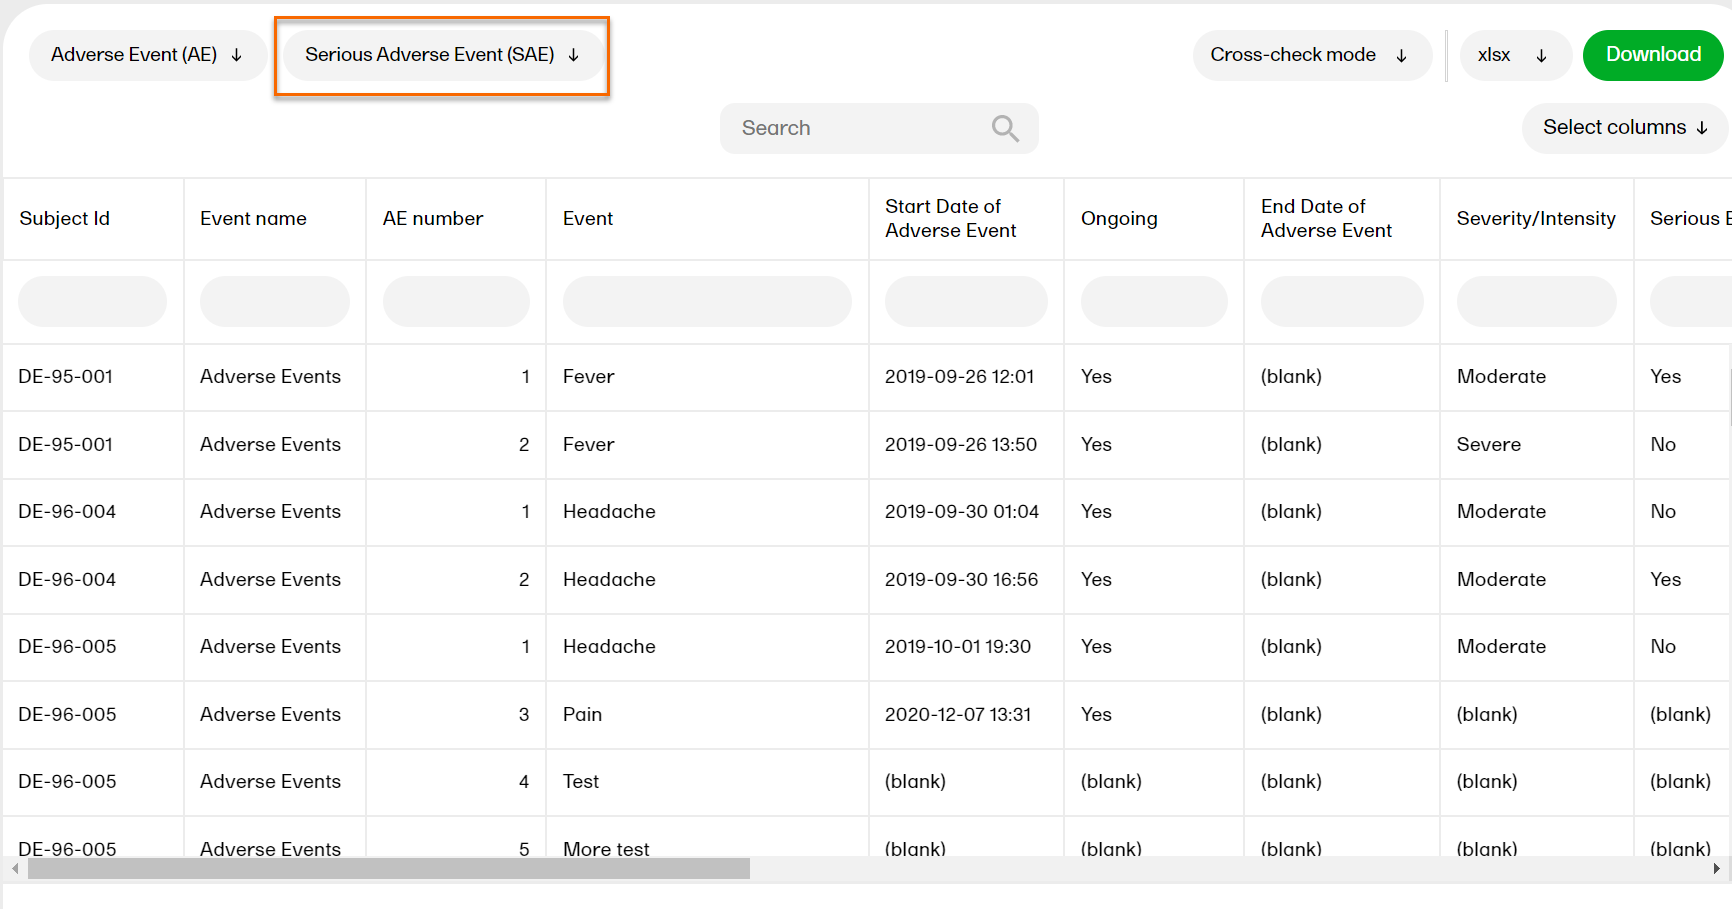
...and a second table appears below the first one:
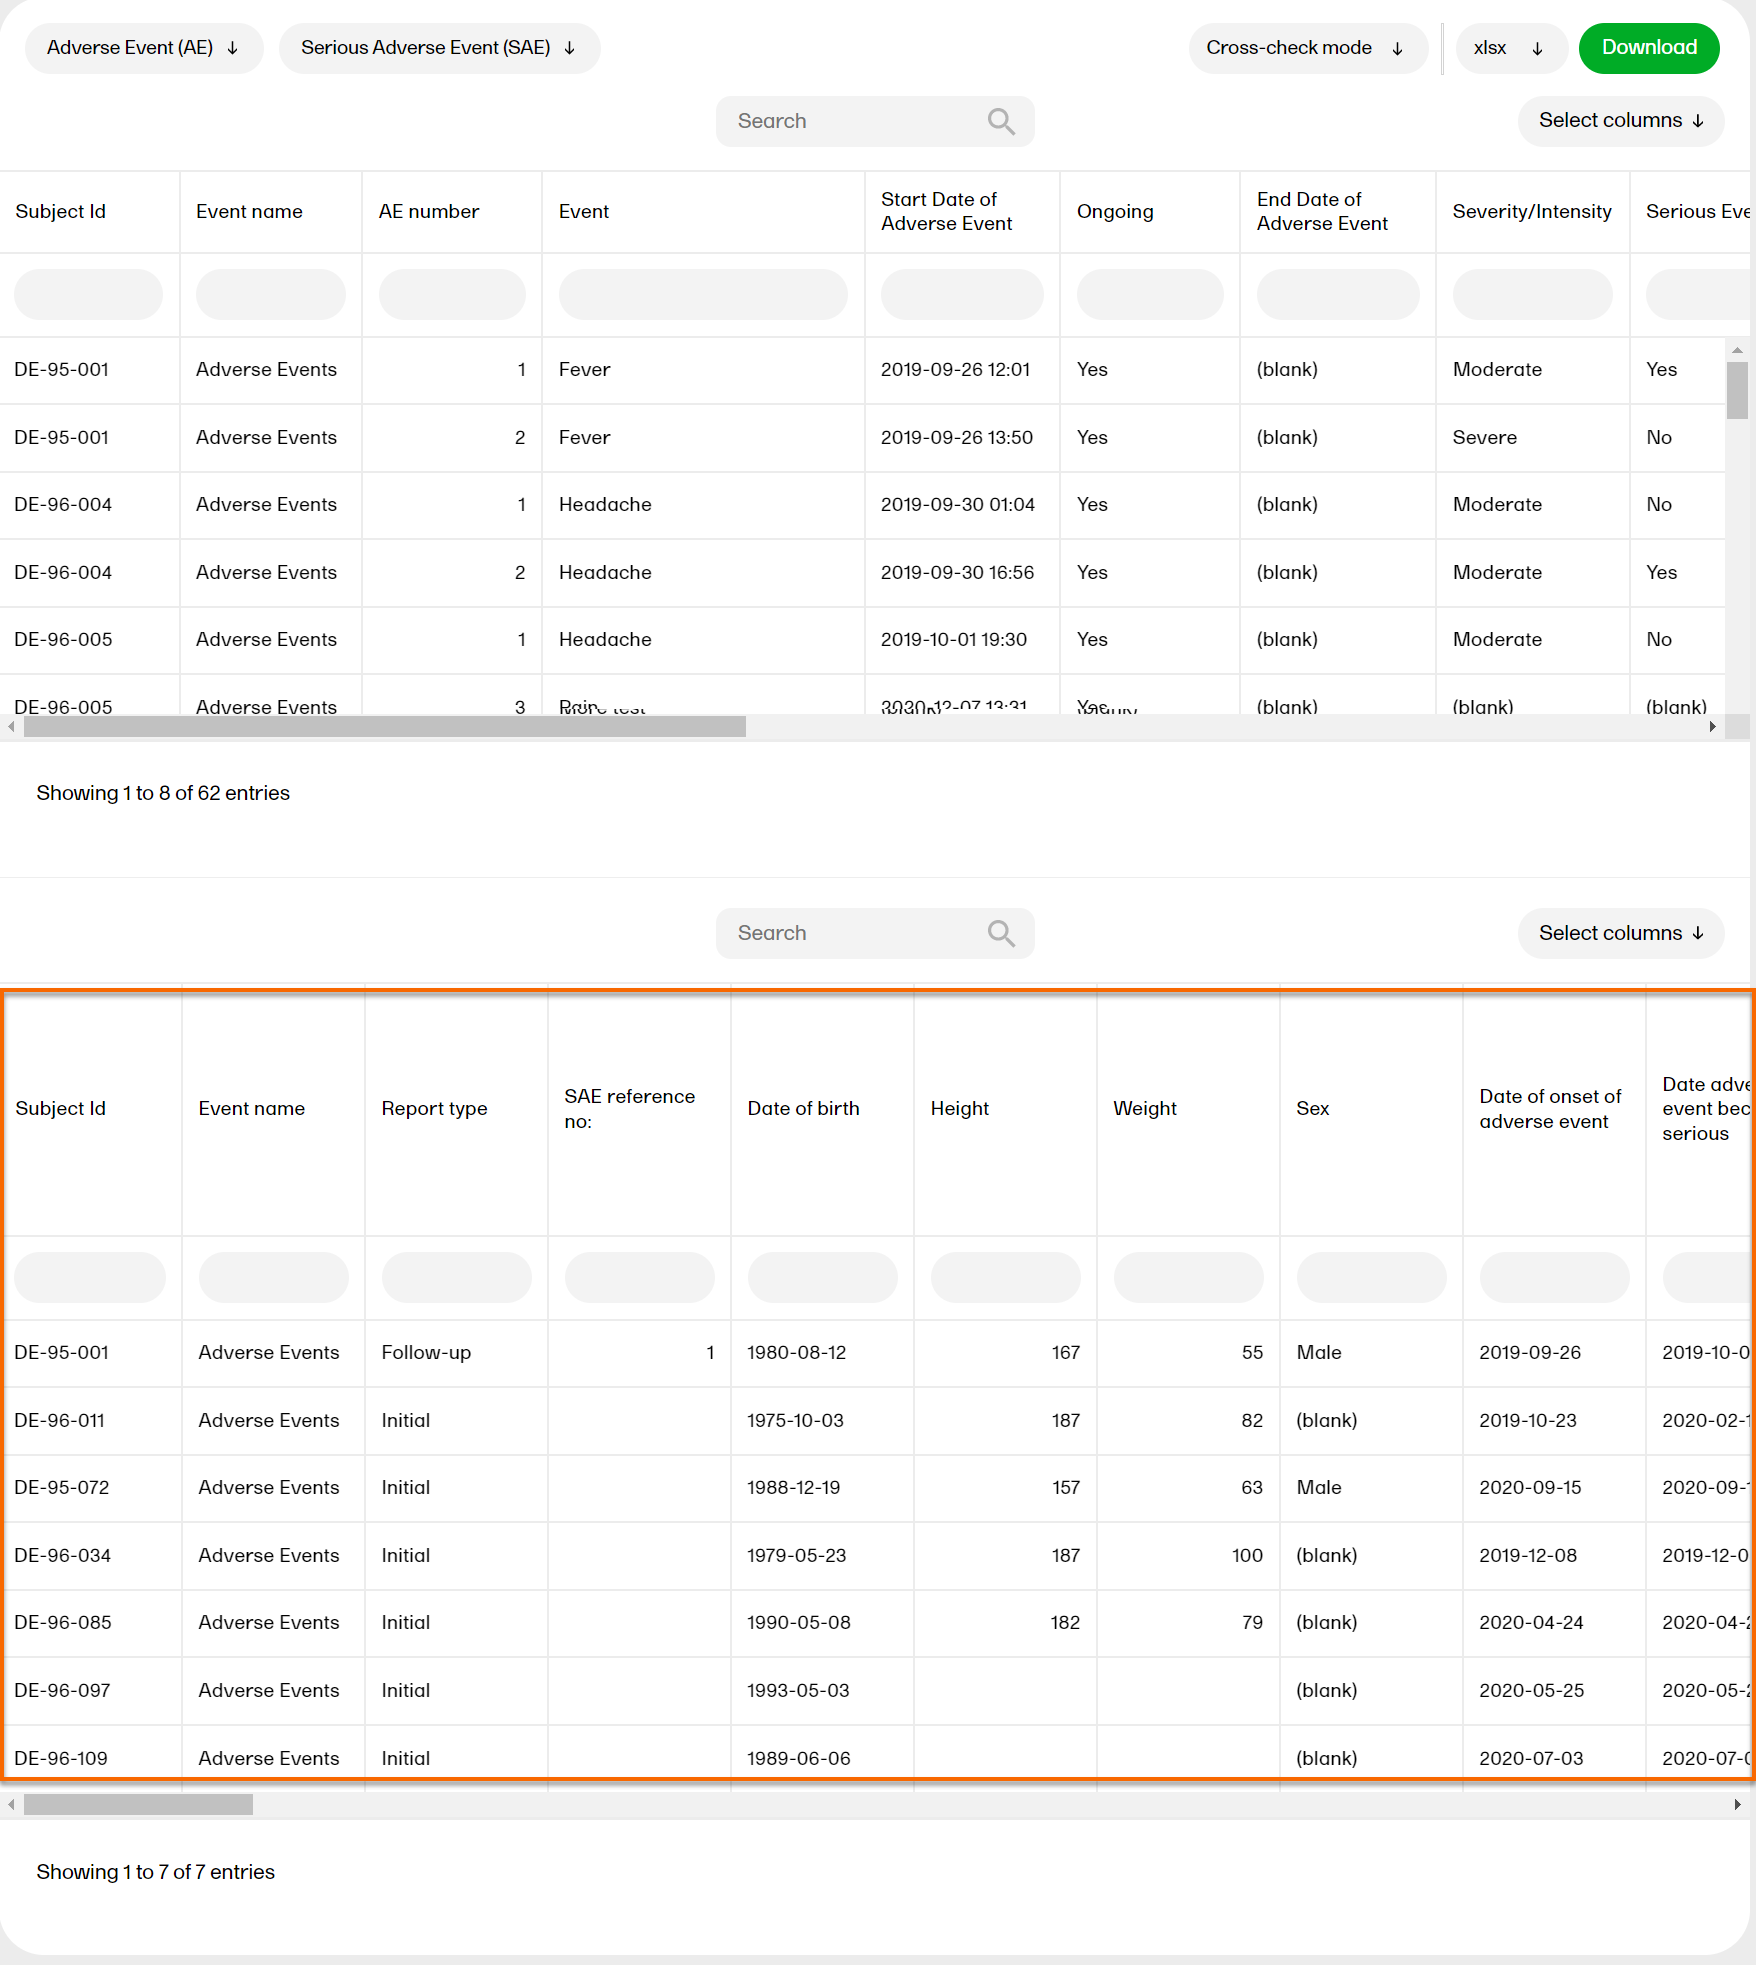
Now you can browse both tables in the same view and compare them.
To close the second table, select Standard mode.
Note! Filters and exports are made individually for each table. The export is added to a zip file, see Downloading browser date for more information.
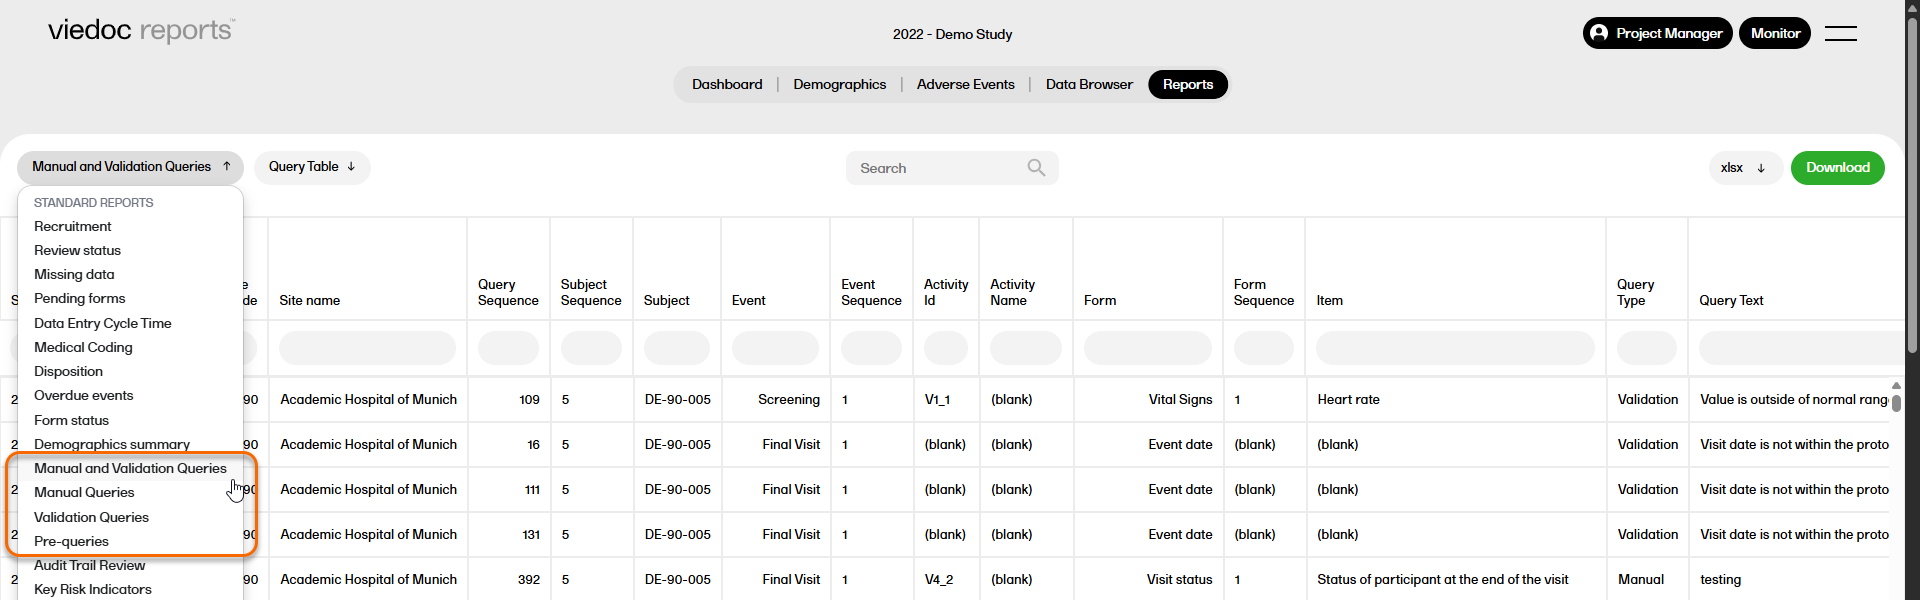
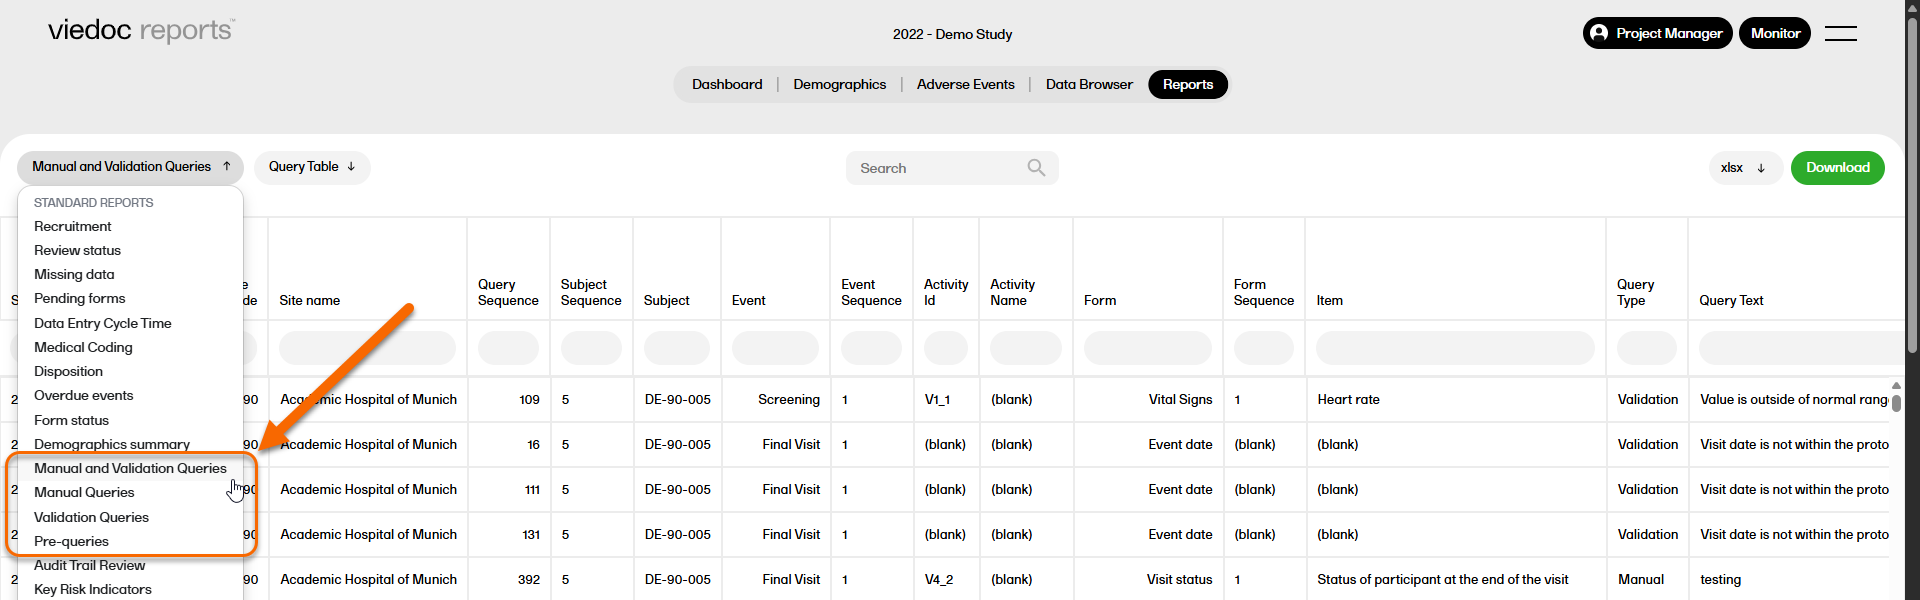
In Viedoc Reports, you can view Standard and Custom reports in the Reports page. Here you can view the reports and sub reports, search, sort and filter the data, and export the results in various formats. Each report will look different and have different functions, which are described in the sections below.
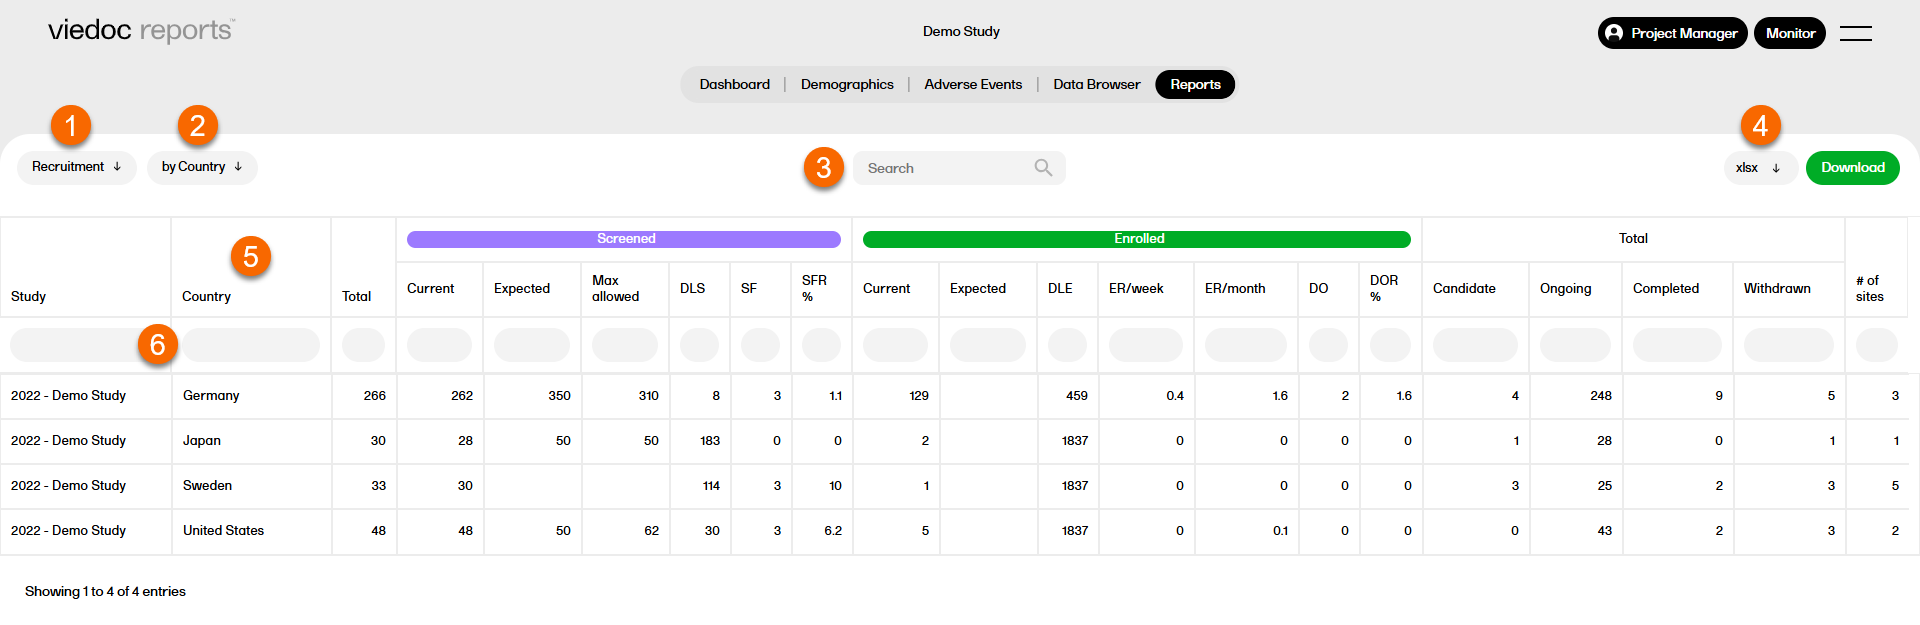
Overview of functions the Reports page, which are standard across reports and sub reports:
1. Select a report from the dropdown list.
2. Select a sub report.
3. Search within the selected report.
4. Select a format to download the report. For more information, see Downloading reports.
5. Select any column header to sort the data in ascending or descending order.
6. Select the space under any column to filter the data by a specific range. Select the x icon to reset the filter.
The following section describes general rules and definitions applicable to all reports.
Reports always use the latest export version. If a new export version is released, users should check the Release Notes to determine if or how their reports or custom reports are affected.
Comment: this text about the data export version exists in overview of Viedoc reports, reports, and creating custom reports lessons.
The reports based on standard data are described in the following sections.
Tip! Many of the standard reports can now be downloaded and customized for use as custom reports. To access the report scripts, please go to the example-standard-reports repository on Viedoc's GitHub.
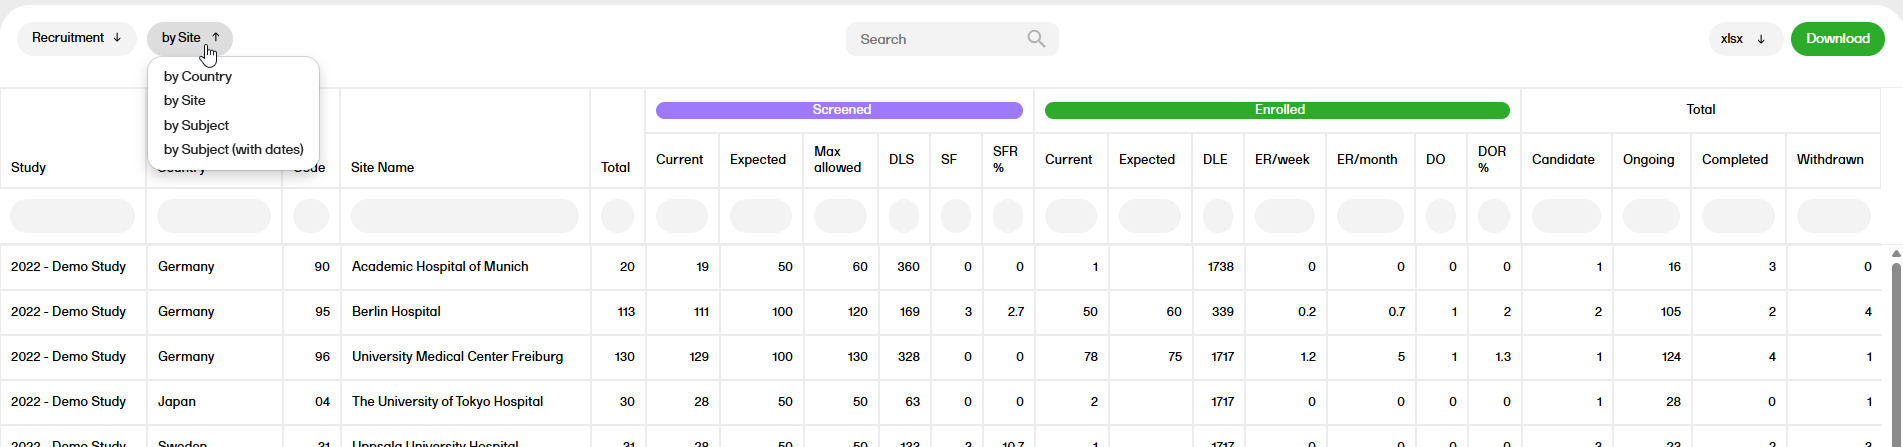
The Recruitment report shows recruitment data with details on the subject status.
For more information on the Recruitment report, please go to: Recruitment
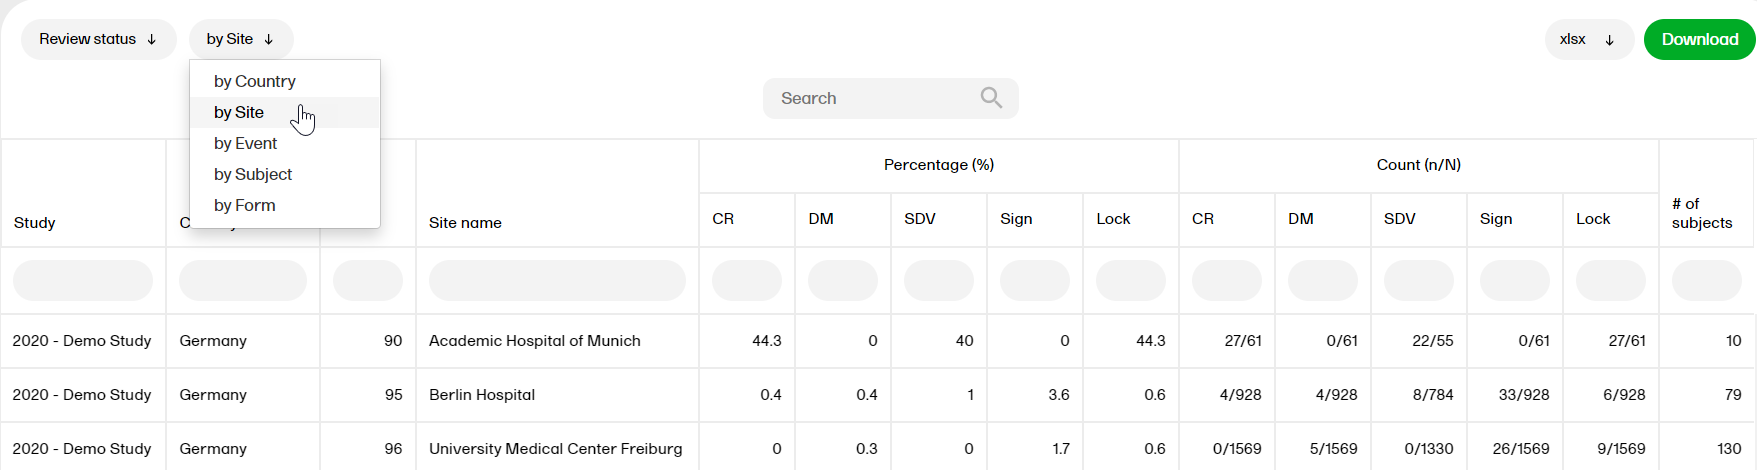
The Review status report shows the review status (Clinical, Data, Source Data Verification (SDV), Sign, and Lock).
For more information on the Review status report, please go to: Review status
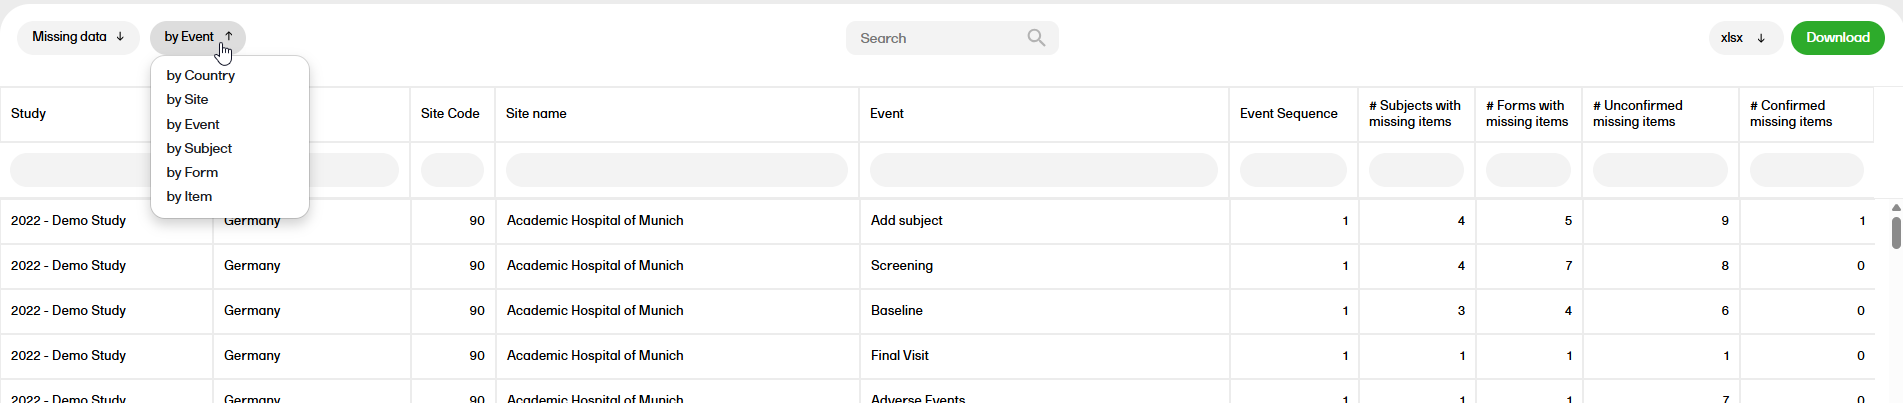
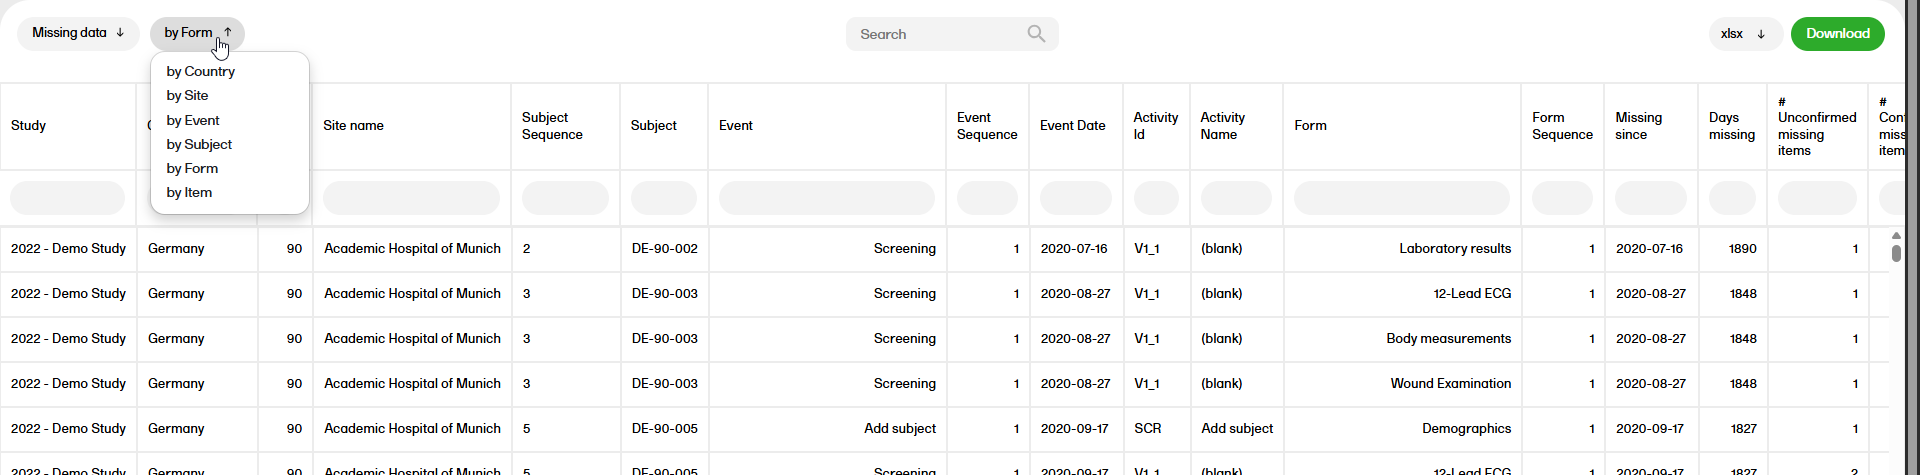
The Missing data report shows the missing items.
For more information on the Missing data report, please go to: Missing data
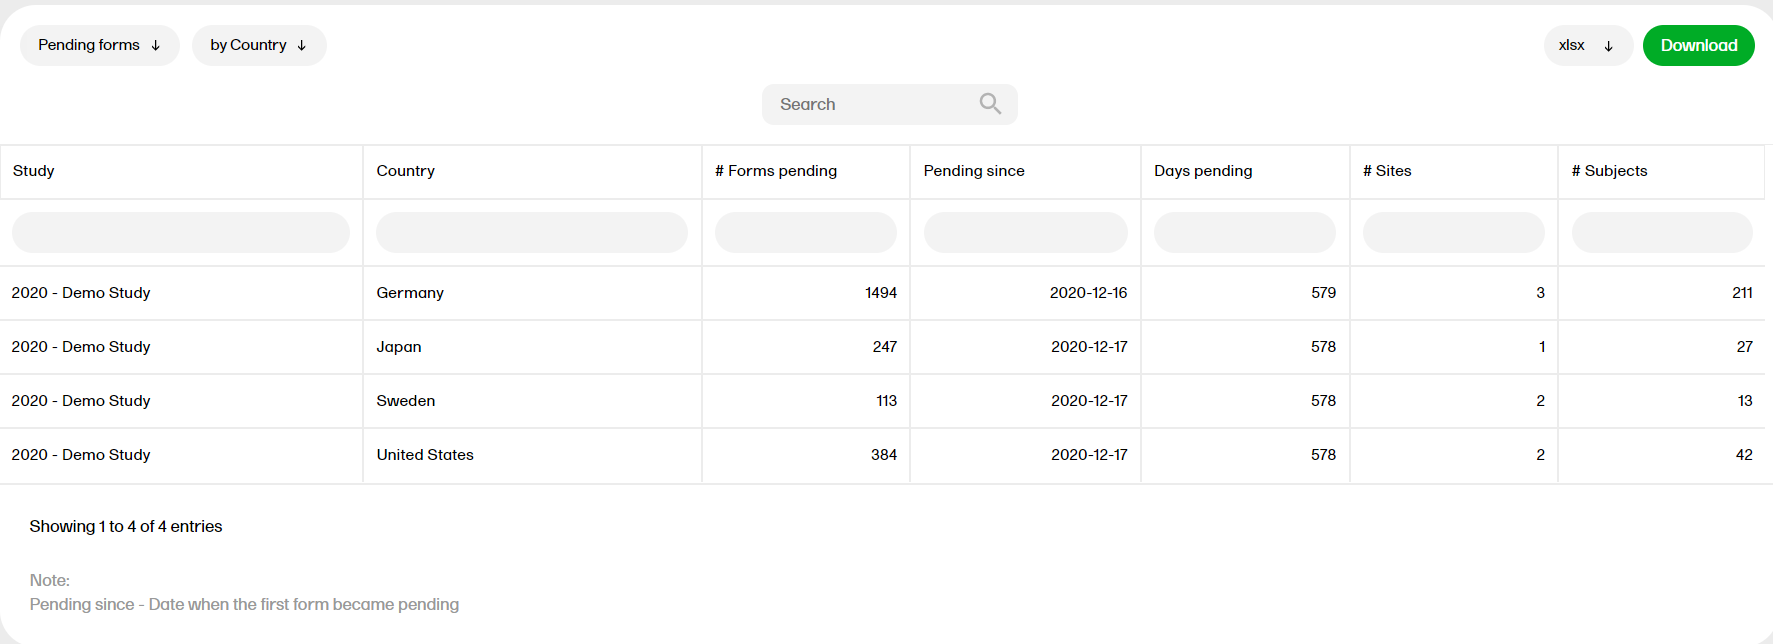
The Pending forms report shows the pending forms. Forms are considered pending when they are uninitiated in initiated events. This applies to all types of events, including subject-initiated events. For repeating forms, if the first instance of the form is uninitiated, the form is considered pending. Resetting a form results in that form being pending.
For more information on the Pending forms report, please go to: Pending forms
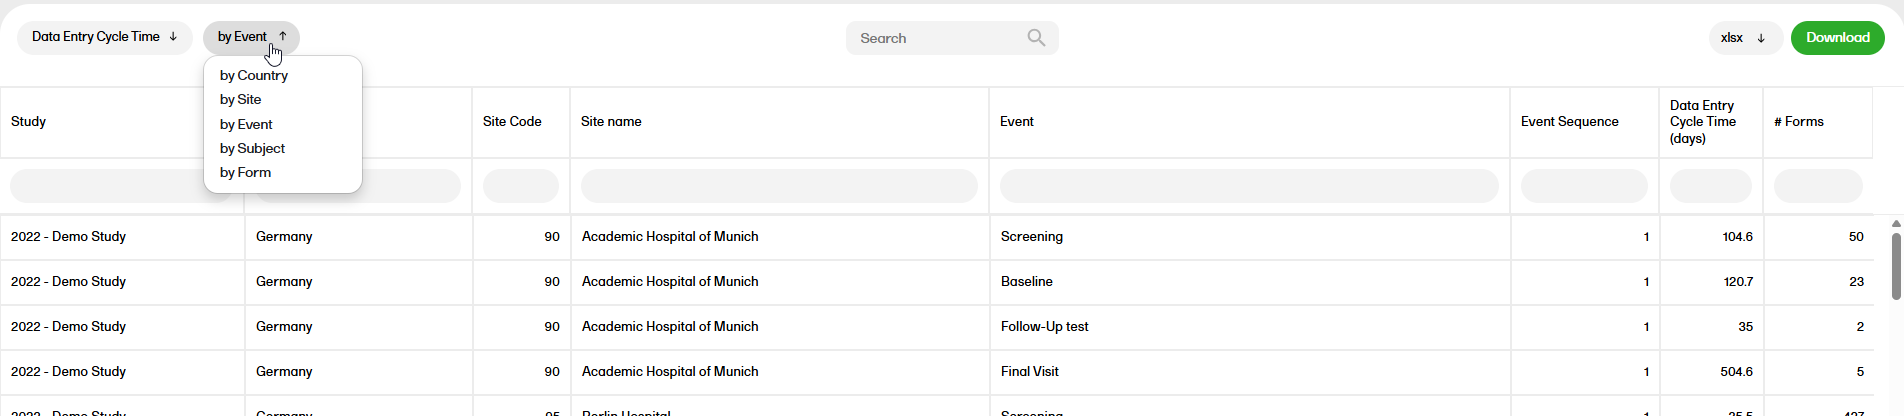
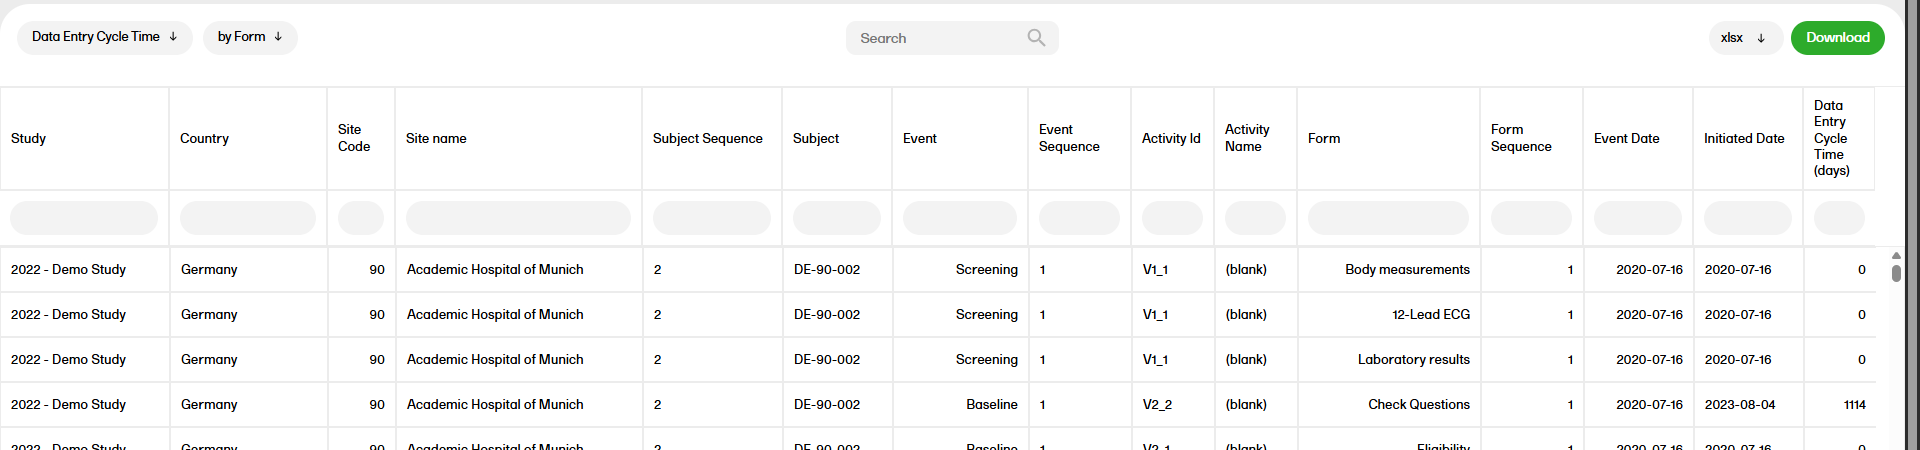
The Data entry cycle time report shows how long time it takes for the sites to enter form data.
For more information on the Data entry cycle time report, please go to: Data entry cycle time
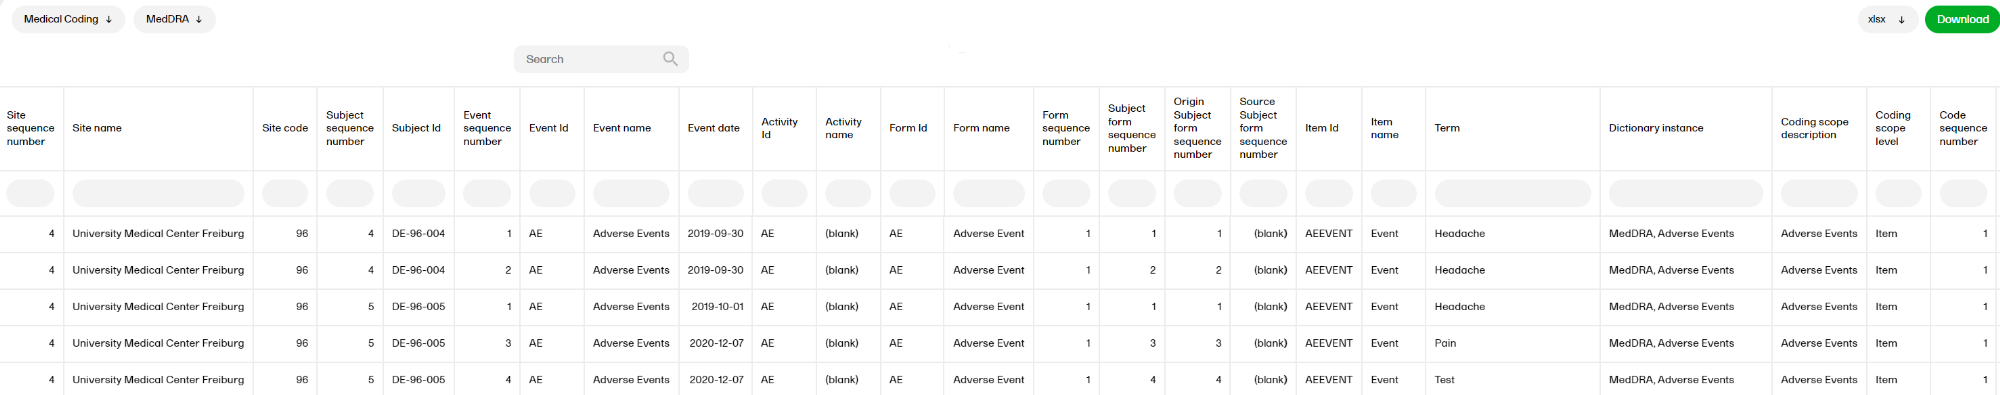
The Medical coding report shows the coded data in the study. You can select reports for the dictionaries WHODrug, MedDRA, MedDRA_J, ATC without DDD, and IDF.
For more information on the Medical coding report, please go to: Medical coding
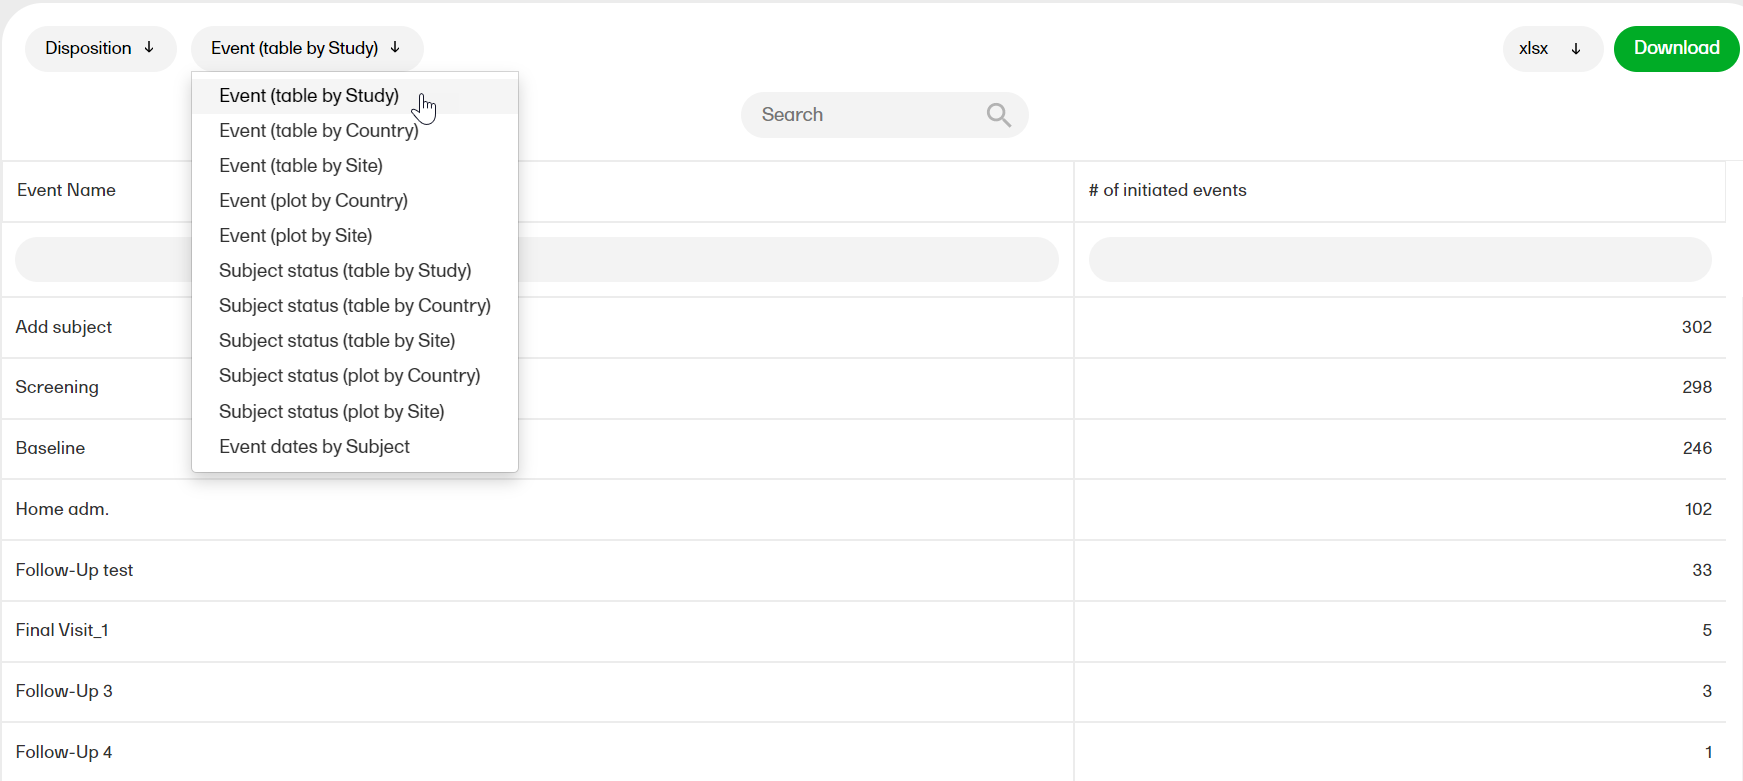
The Disposition report shows overviews of the current disposition status of the subjects across the study.
For more information on the Disposition report, please go to: Disposition
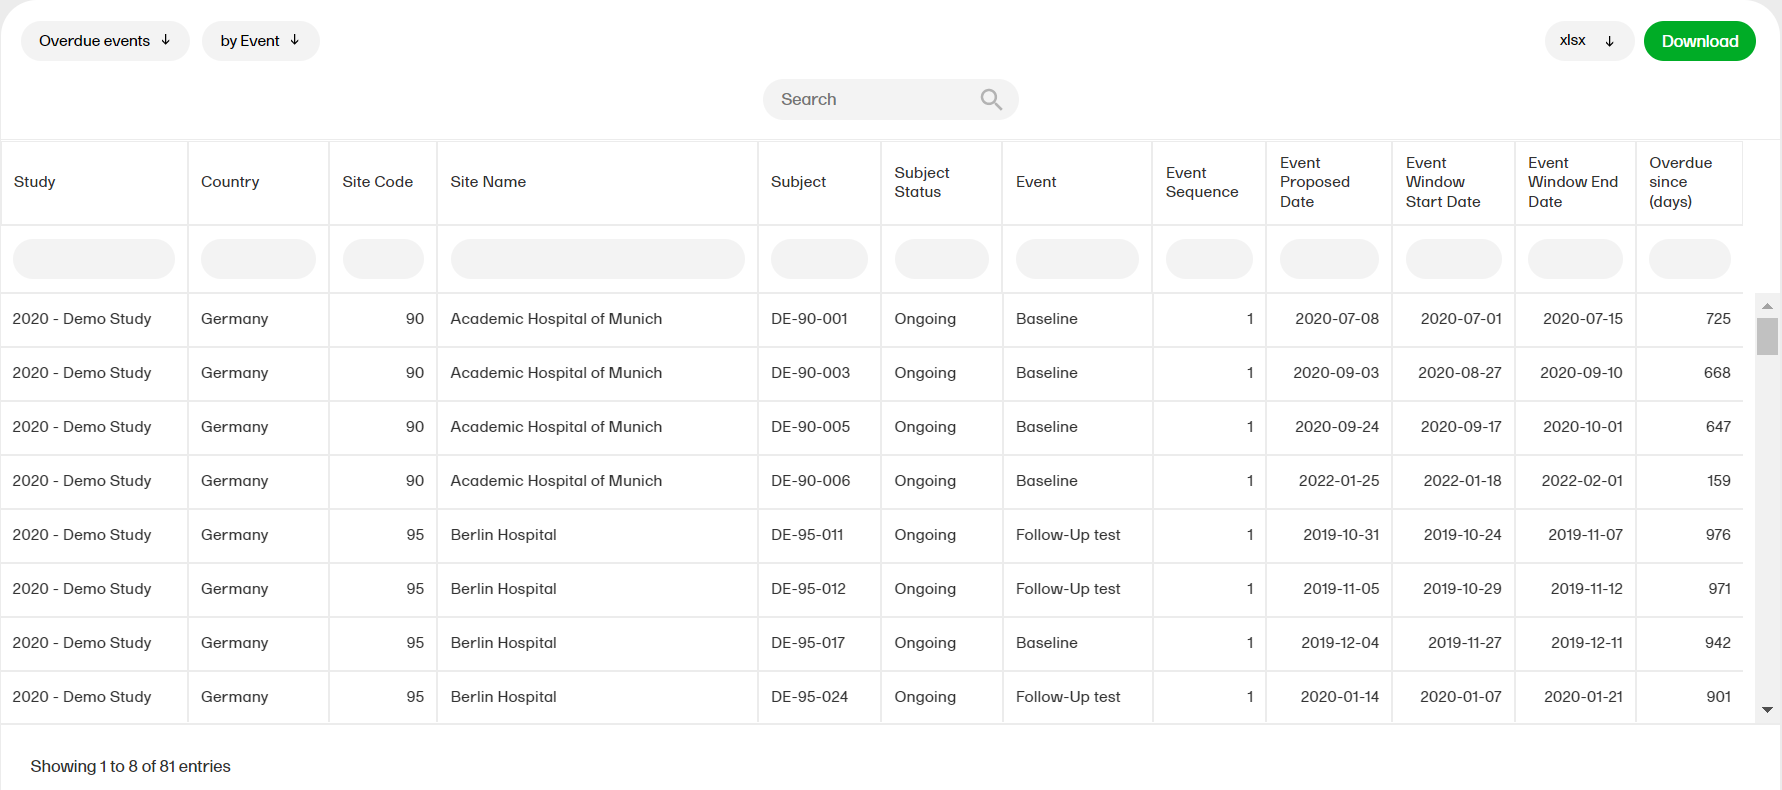
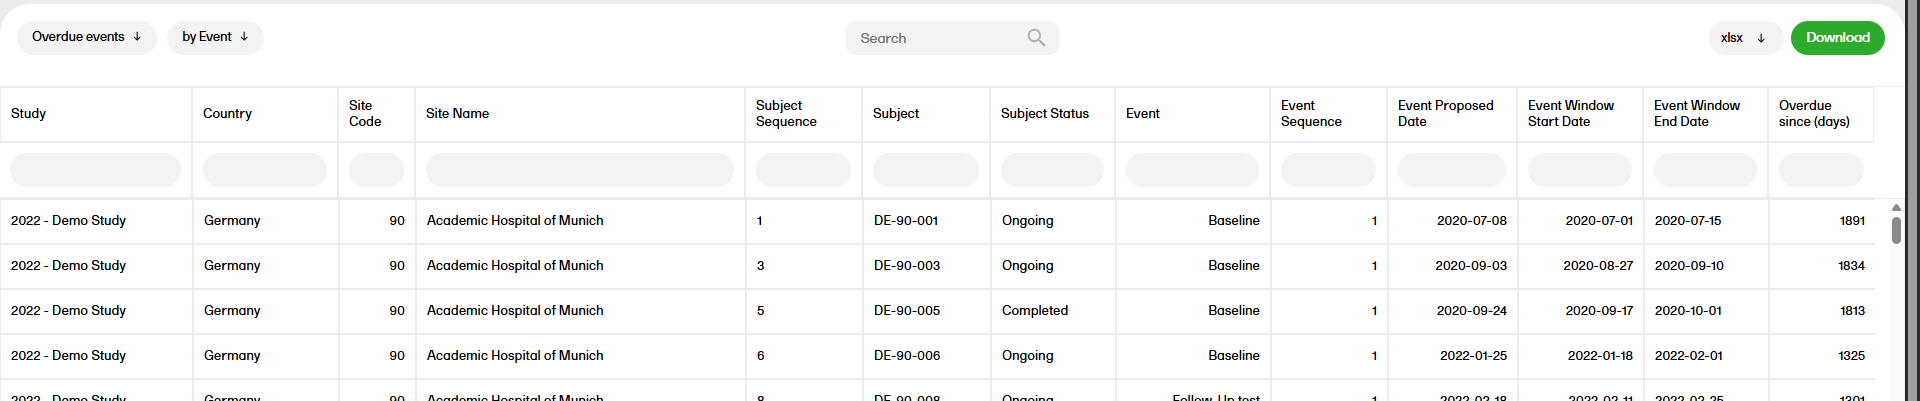
The Overdue events reports for the sub reports ‘by Country', ‘by Site', ‘by Subject', ‘by Event’ shows the events that have the Proposed date and Event Window End Date set to a past date.
For more information about the Overdue events report, please select this link: Overdue events
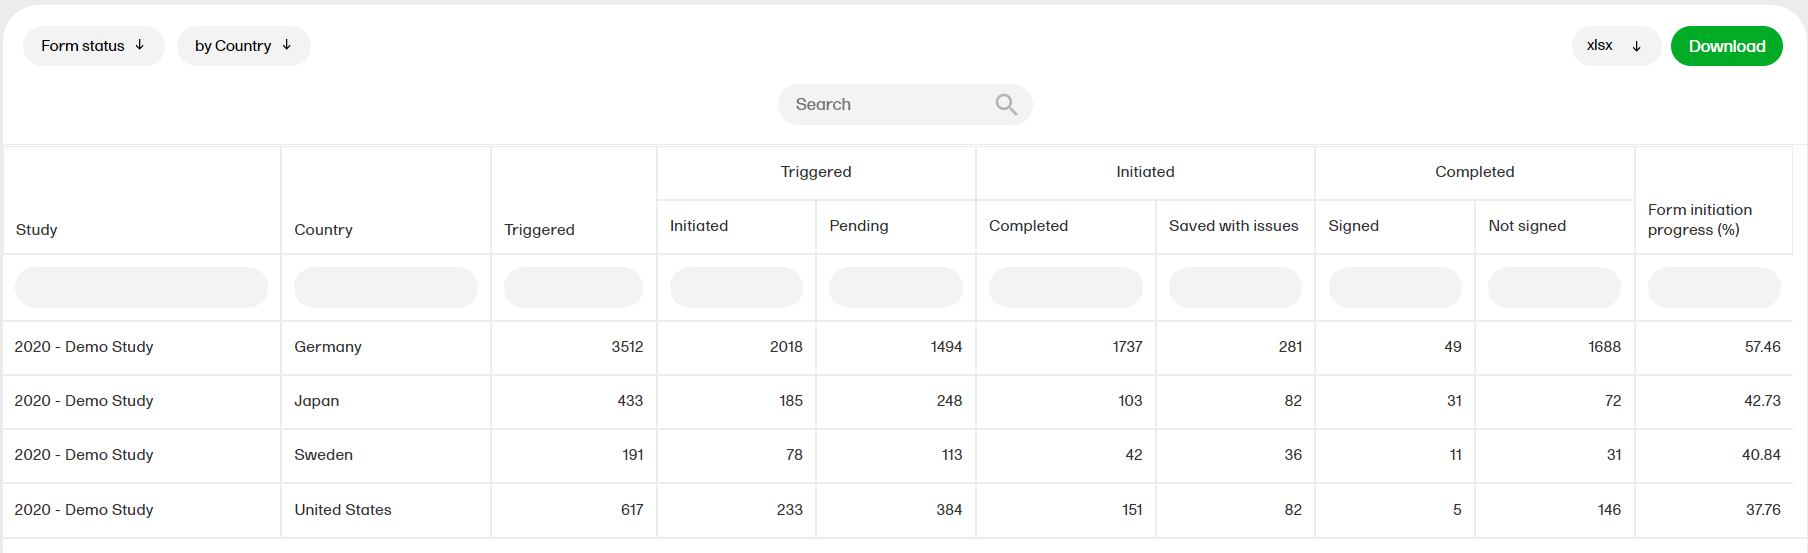
The form status report gives an overview of the status of forms, for example, initiated, pending, completed, saved with issues, unsigned etc.
For more information on the Form status report, please select this link: Form status
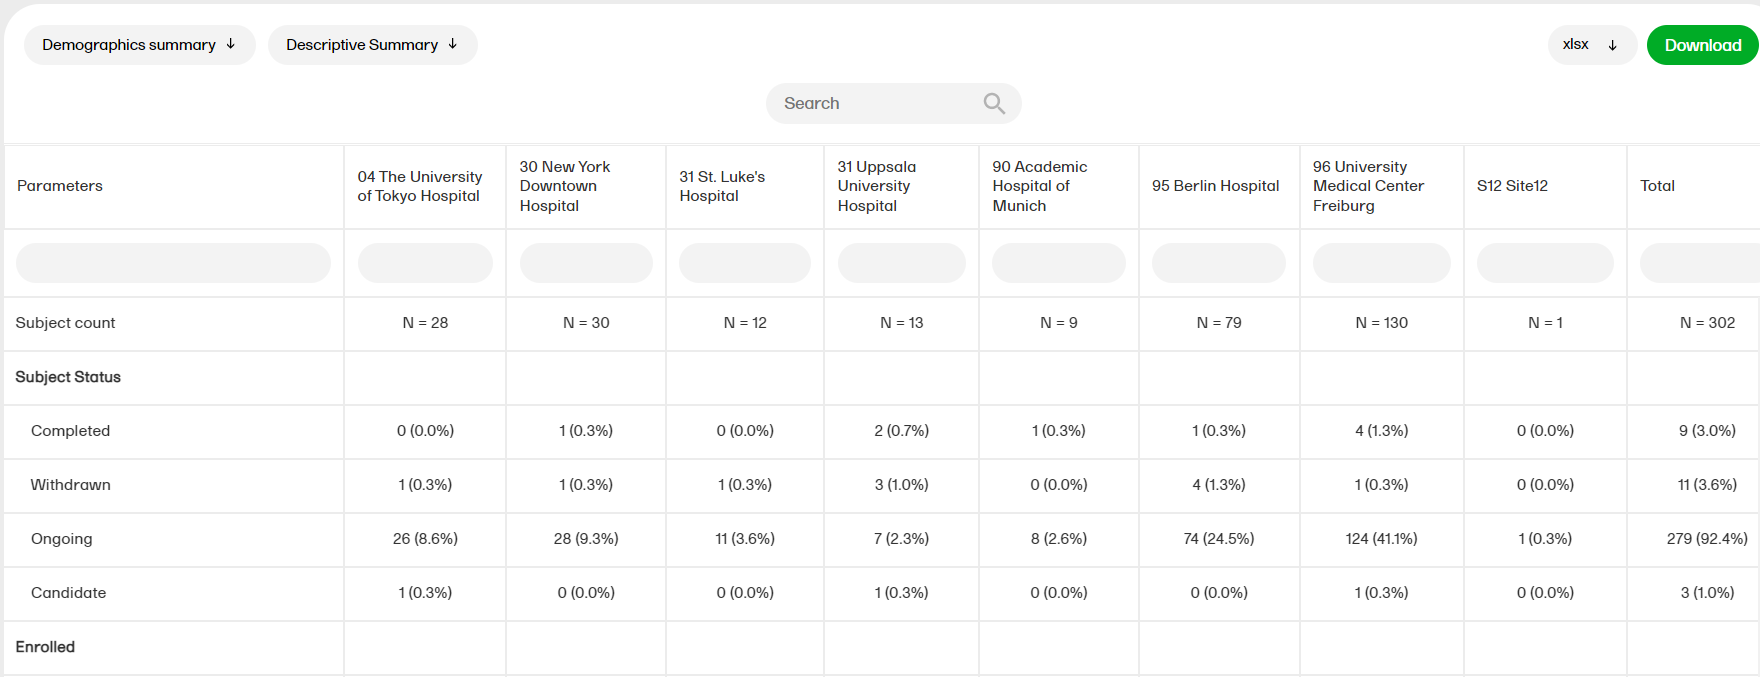
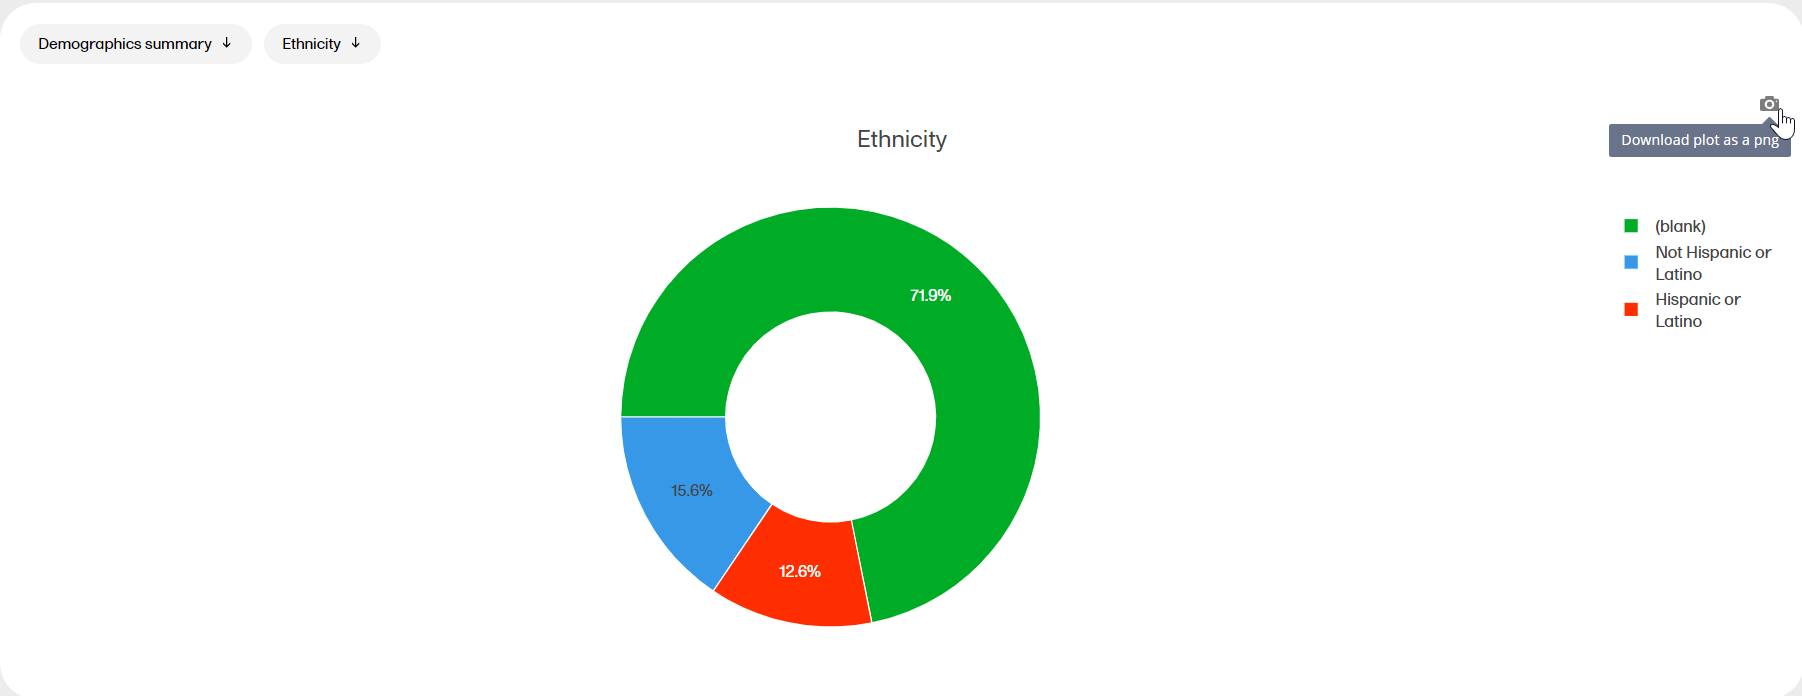
The Demographics summary report shows a table and a pie chart with the variables from the Demographics page.
For more information on the Demographics summary report, please go to: Demographics summary
There are four query reports available (manual and validation queries, manual queries, validation queries, pre-queries) that show the detailed query data at different levels across the studies.
For more information on Query reports, please go to: Query reports
The Audit trail review report shows divergences to the normal data entry pattern as well as the general performance. This report has two sub reports, Overview and Change over time.
For more information on the Audit Trail Review report, please go to: Audit trail Review
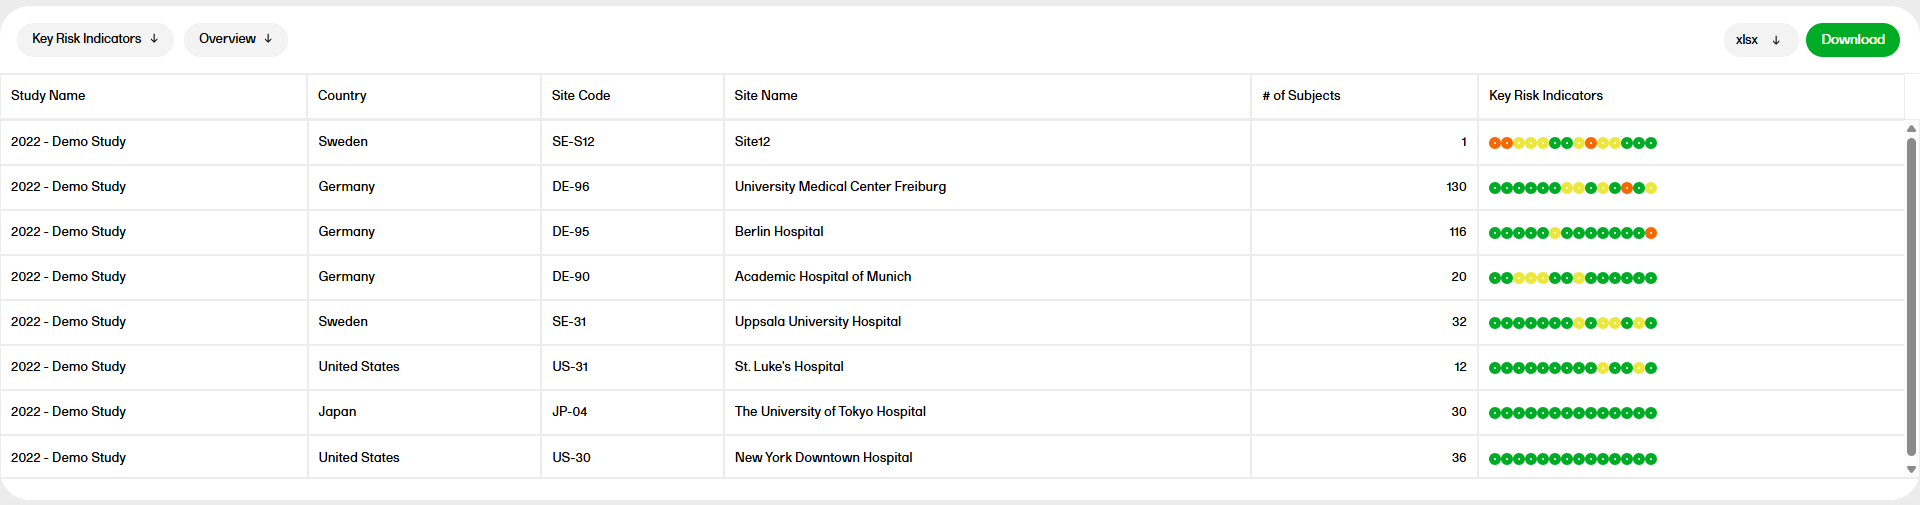
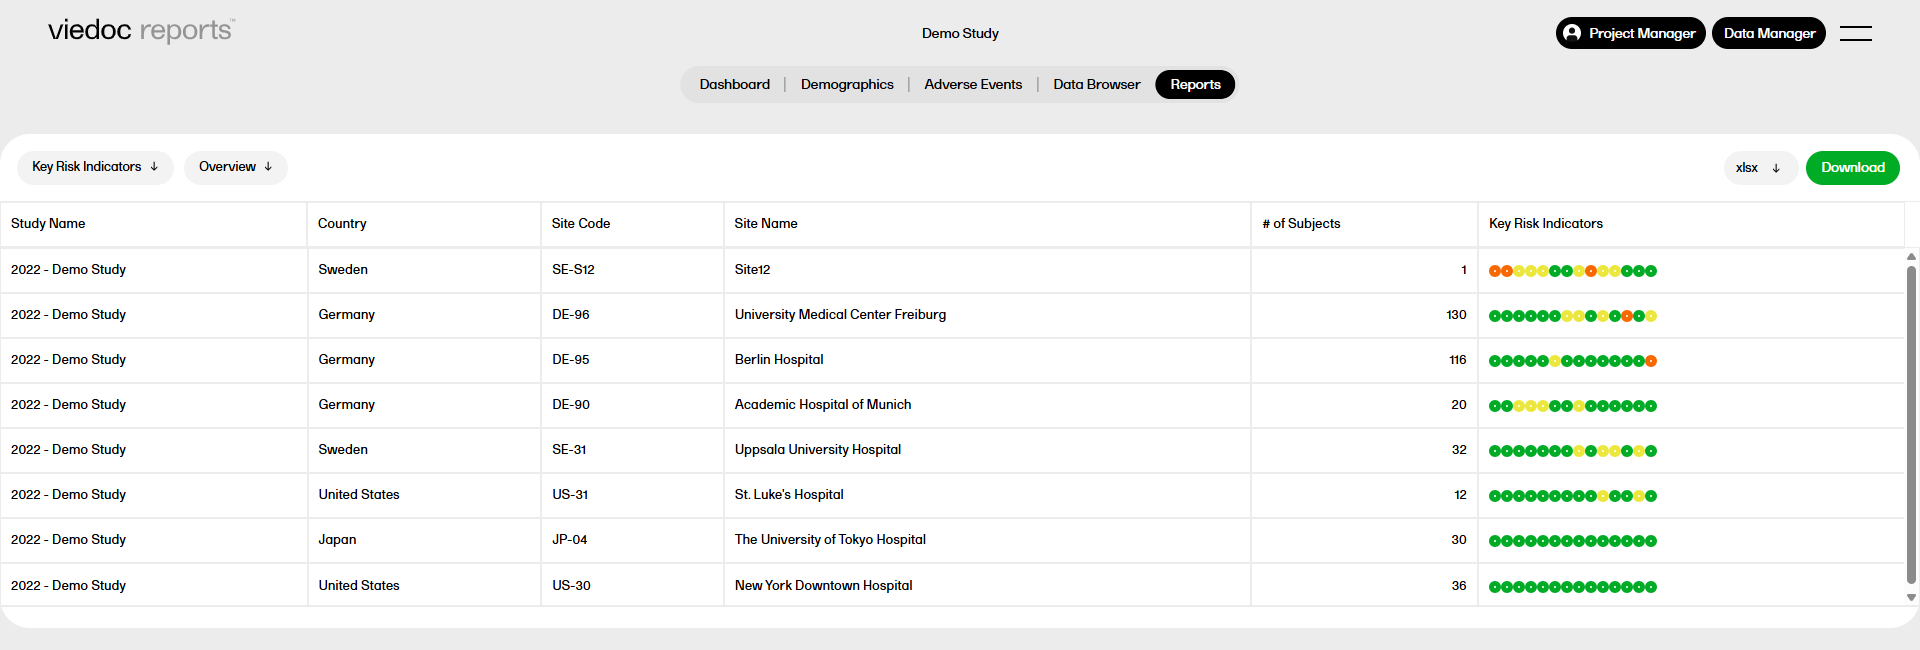
The Key risk indicators (KRI) report gives you a quick overview of the key risk indicators per site. This report has three sub reports: Overview, by Site, and by Key risk indicator.
For more information on the Key risk indicators report, please go to: Key risk indicators report.
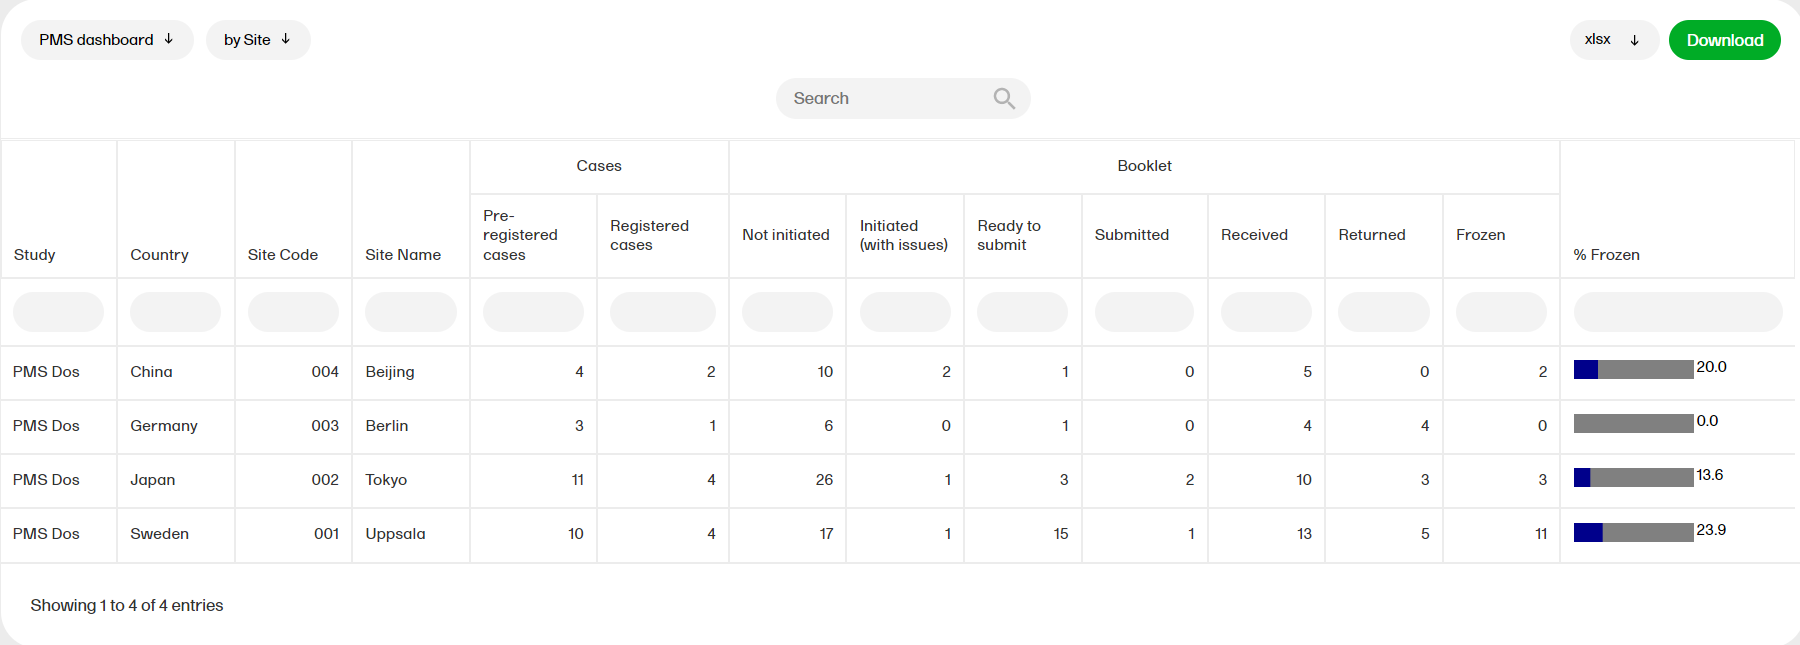
The PMS dashboard report is available for Japanese PMS studies only and shows the following booklet statuses. You can sort the data to focus on the booklet status by site, subject, booklet, booklet history, or timelapse with the following columns showing, respectively:
by Site
This shows a site level summary of booklets status along with the number of pre-registered and registered cases. Booklet freeze progress as a percentage is shown as a bar plot.
by Subject
This shows a subject-level summary of booklet status along with the Subject added date and Subject completed date. Booklet freeze progress as a percentage is shown as a bar plot.
by Booklet
This shows a booklet level summary of current booklet status and last activity date along with the number of open, resolved and closed queries.
by Booklet (history)
This shows the Booklet status history- the user can filter for a specific date along with the Subject added date from the subjectAddedDate.rds file.
Note! This does not include "Not Initiated" records.
Timelapse
Time to Resolution shows the timelapse between the time raised to the time resolved or closed for each booklet status, summarized at Subject level.
Time to Approval shows the timelapse between the time resolved to the time approved OR rejected for each booklet status, summarized at Subject level.
Note! This is for subjects that have at least one booklet that has been Initiated and submitted. Also, the lapse in Resolved and Closed queries for a subject is obtained from Queries and displayed.
The reports under Custom reports are tailor-made and study-specific. Custom reports can be downloaded at all times, regardless of the user permission set for the role in Viedoc Designer.
Tip! Several report templates can now be downloaded as R scripts and customized for use as custom reports. To access the report scripts, please go to the custom-reports repository on Viedoc's GitHub.
The sort filters and columns showing the data depend on the report. Here you can see an example where the custom report DM Custom contains two filters, Demog1 and Demog2 (not visible in the image):
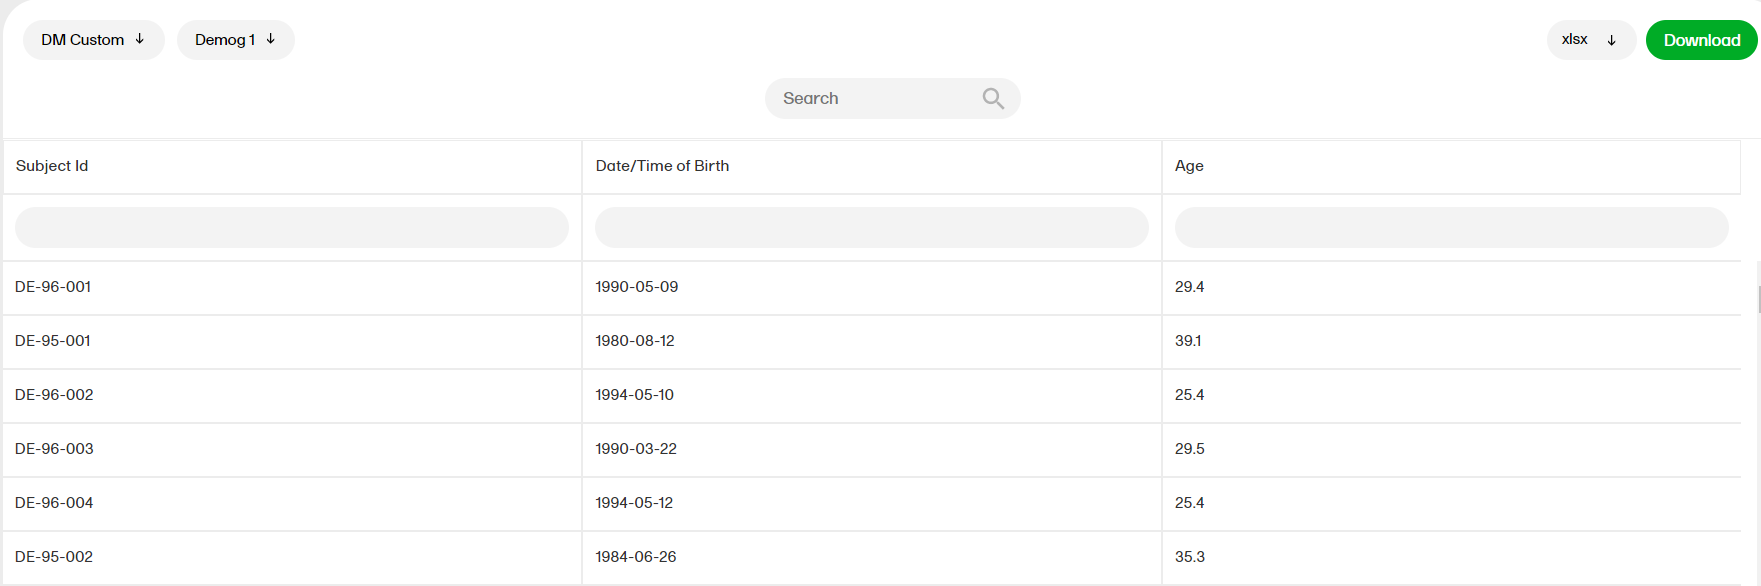
Note! Some columns of the report may be empty, this is due to the visibility settings for your user role on CRF level.
For more information, go to the Creating custom reports lesson.
You can download the reports in the following formats:
reportOutput <- list("xml" = new_xml_1)Identifier: validationCheck <- "Identifier"E2BNote!
[STUDYNAME_REPORTNAME_DATE/TIMESTAMP.FORMAT]
If sub reports are available, then the file name is:
[STUDYNAME_REPORTNAME_SUBREPORT_DATE/TIMESTAMP.FORMAT]
[DATE/TIMESTAMP] is in the following structure:
[YYYYMMDDHHMMSS], which is the date and time at which the data was downloaded from Viedoc (through the daily data sync).
Example of a file name: "DemoStudy2020_Review status_20200903220345.csv"
There are two ways of downloading reports on the Reports page. You can either download a selected Standard report or download all the Standard reports.
To download data from a selected Standard report:
| 1. |
Select the specific report you want to download from the STANDARD REPORTS dropdown menu. In the example below, the Recruitment report is selected. 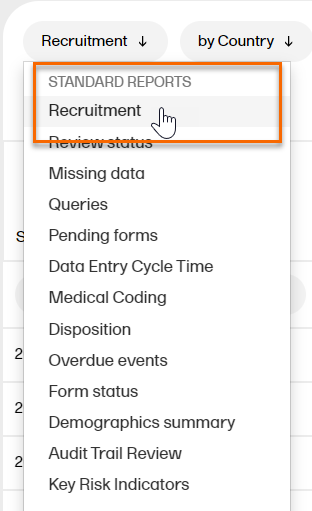
|
| 2. |
In Settings, select Download selected subreport in the dropdown menu. 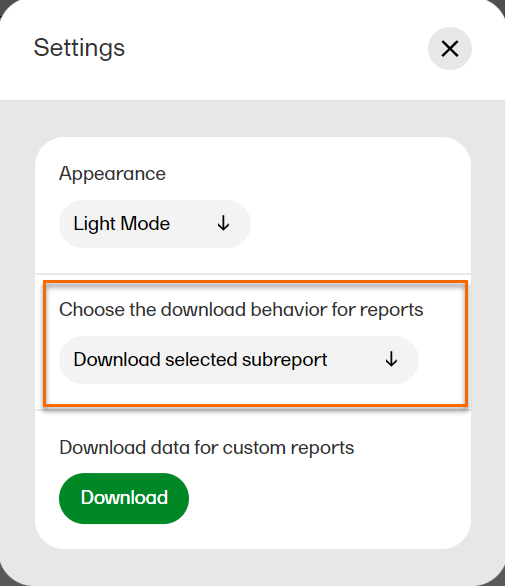
|
| 3. |
1. Select a format to download. 2. Select Download. 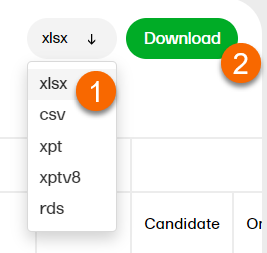
|
To download data from all Standard reports simultaneously:
| 1. |
In Settings, select Download all subreports in the dropdown menu. 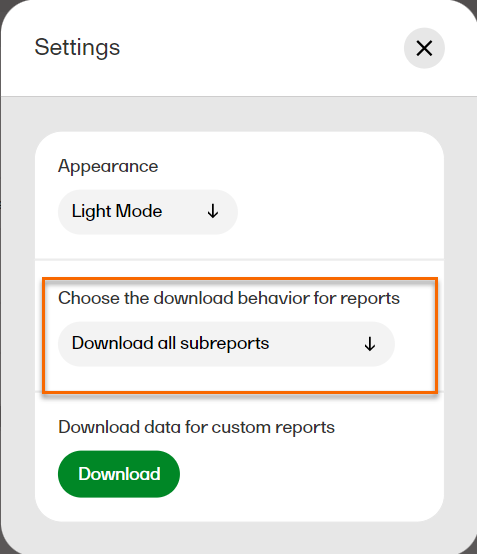
|
|
2. |
1. Select a format to download. 2. Select Download.
Note! When the formats xlsx/csv/xpt/xptv8 are selected, a zip file is created. The structure of the file name is as follows: [STUDYNAME_REPORTNAME_DATE/TIMESTAMP.zip].
Example of a file name: Demo Study_Recruitment_202203230002854.xlsx
Example of a file name: Demo Study_Recruitment_by Country_20220329230643.rds
|
Note!
There is a possibility that Viedoc Reports will fall out of sync. If Viedoc Reports falls out of sync, we suggest that you take the following steps to reset and reinitiate the sync job.
| 1. | Disable Viedoc Reports in Viedoc Admin/Study settings. |
| 2. | Wait 1 hour. |
| 3. | Enable Viedoc Reports in Viedoc Admin/Study settings. |
The sync will be reset and reinitiated. Your Viedoc Reports should display the correct data. If you continue to encounter an issue please contact your Viedoc representative.
You can sort the data to focus on recruitment status by country, site, or subject, with the following columns showing, respectively:
by Country
by Site
by Subject
by Subject (with dates)
The definition of the recruitment report, based on the following subject status definitions being met in Viedoc Designer, is as follows:
Note! The subject status definitions are as defined in the individual study on the Study settings page.
These flags are summarized at site and country level, and the following values are calculated:
Elapsed days is defined as:
Below you will find a detailed descriptions of different sub reports.
| Sub report | Description |
|---|---|
| Study | The name of the study. |
| Country | The country-level location where the study takes place. |
| Total | The total number of subjects. |
| Site Code | The code for the site. (Applies only to Site, Subject, and Subject (with dates) sub reports). |
| Sub report | Description |
|---|---|
| Country | The total number of subjects with ScreenState 'Yes'. All sub reports are defined in the study design. |
| Site | |
| Subject | |
| Subject (with dates) |
| Sub report | Description |
|---|---|
| Country | The Admin defines 'Screened - Expected' in the Study Settings based on individual sites. |
| Site |
| Sub report | Description |
|---|---|
| Country | The Admin defines 'Screened - Max allowed' in the Study Settings based on the site. |
| Site |
| Sub report | Description |
|---|---|
| Country | Days since latest screening - The number of days since the latest screened date. The date is set by the location of the site. |
| Site |
| Sub report | Description |
|---|---|
| Country | Screen failure - The subjects screened and withdrawn and not enrolled. |
| Site |
| Sub report | Description |
|---|---|
| Country | Screened failure rate - If 'Screened - Current' is 0 then the SFR% is 0. If 'Screened - Current' is over 0, then the result is rounded to the first decimal point. |
| Site |
| Sub report | Description |
|---|---|
| Country | In the Country and Site sub reports, the total is the sum of EnrolledState 'Yes'. All sub reports are defined in the study design. |
| Site | |
| Subject | |
| Subject (with dates) |
| Sub report | Description |
|---|---|
| Country | The Admin defines 'Enrolled - Expected' in Study Settings based on the site. |
| Site |
| Sub report | Description |
|---|---|
| Country | Days since latest enrolment - The number of days since the latest EnrolledOnDate. The date is set by the location of the site. |
| Site |
| Sub report | Description |
|---|---|
| Country | Enrolment rate per week (ER/week) - The 'Enrolled - Current' / (elapsed days / 7). The quotient is rounded to the first decimal point. |
| Site |
| Sub report | Description |
|---|---|
| Country | Enrolment rate per month (ER/month) - The 'Enrolled - Current' / (elapsed days / 7). The quotient is rounded to the first decimal point. |
| Site |
| Sub report | Description |
|---|---|
| Country | Drop-out - Subjects enrolled and withdrawn. |
| Site |
| Sub report | Description |
|---|---|
| Country | Drop-out rate - The 'Enrolled DO' / 'Enrolled Current'. If 'Enrolled - Current' is 0 then the DOR is 0. If 'Enrolled - Current' is greater than 0, then the result is rounded to the first decimal point. |
| Site |
| Sub report | Description |
|---|---|
| Country | The total number of subjects not screened and not withdrawn and not completed. |
| Site | |
| Subject | |
| Subject (with dates) |
| Sub report | Description |
|---|---|
| Country | The total number of subjects screened and not withdrawn and not completed. |
| Site | |
| Subject | |
| Subject (with dates) |
| Sub report | Description |
|---|---|
| Country | The total number of subjected Completed as defined in the study design. |
| Site | |
| Subject | |
| Subject (with dates) |
| Sub report | Description |
|---|---|
| Country | The total number of subjects withdrawn as defined in the study design. |
| Site | |
| Subject | |
| Subject (with dates) |
| Sub report | Description |
|---|---|
| Subject | The reason a subject has withdrawn from a study. |
| Subject (with dates) |
| Column | Sub report | Description |
|---|---|---|
| Screened Date | Subject (with dates) | Defined in the study design. The date is taken from the event date form. Add (UTC) or (local time) where applicable. |
| Enrolled Date | Subject (with dates) | |
| Completed Date | Subject (with dates) | |
| Withdrawn Date | Subject (with dates) | Defined in the study design. The date is taken from with the reason for withdrawal is saved. |
Note! The subject status definitions are as defined in the individual study on the Study settings page.
You can sort the data to focus on the review status by country, site, event, subject, or form, with the following columns showing, respectively:
by Country
by Site
by Event
by Subject
by Form
n/N = number of forms reviewed for a specific status / total number of forms it is possible to review for a specific status.
Notes!
| Sub report | Description |
|---|---|
| Country | The percentage of the initiated forms that have been reviewed of the initiated forms that can be reviewed. (Hidden forms are not considered). |
| Site | |
| Event | |
| Subject |
| Sub report | Description |
|---|---|
| Country | The percentage of initiated forms that have been data reviewed of the initiated forms that can be data reviewed. (Hidden forms are not considered). |
| Site | |
| Event | |
| Subject |
| Sub report | Description |
|---|---|
| Country | The percentage of initiated forms that have been source data verified of the initiated forms that can be source data verified. (Hidden forms are not considered). |
| Site | |
| Event | |
| Subject |
| Sub report | Description |
|---|---|
| Country | The percentage of initiated forms that have been 'signed' of the initiated forms that can be 'signed'. (Hidden forms are not considered). |
| Site | |
| Event | |
| Subject |
| Sub report | Description |
|---|---|
| Country | The percentage of initiated forms that have been 'locked' of the initiated forms that can be 'locked'. (Hidden forms are not considered). |
| Site | |
| Event | |
| Subject |
| Sub report | Description |
|---|---|
| Country | n = Clinical reviewed forms. N = The total number of initiated forms where CR is required (hidden forms are not considered for CR). |
| Site | |
| Event | |
| Subject |
Note! n/N = number of forms reviewed for a specific status / total number of forms it is possible to review for a specific status.
| Sub report | Description |
|---|---|
| Country | n = Data reviewed forms. N = The total number of initiated forms where DM is required (hidden forms are not considered for DM). |
| Site | |
| Event | |
| Subject |
| Sub report | Description |
|---|---|
| Country | n = Source data verified forms. N = The total number of initiated forms where source data verification is required, either for the entire form or at least one item on the form. |
| Site | |
| Event | |
| Subject |
| Sub report | Description |
|---|---|
| Country | n = Signed forms. N = The total number of initiated forms where Sign is required (hidden forms are not considered for Sign). |
| Site | |
| Event | |
| Subject |
| Sub report | Description |
|---|---|
| Country | n = Locked forms. N = The total number of initiated forms where Lock is required (hidden forms are not considered for Lock). |
| Site | |
| Event | |
| Subject |
| Sub report | Description |
|---|---|
| Country | The total number of subjects. |
|
Site |
|
| Event |
| Description | |
|---|---|
| Event | A reviewed item will display an event, if the review action was performed on the event date. |
| Form | A reviewed item will display a form, if the review action was performed at the form level. |
| Description |
|---|
| The Username and ID of the user who performed the clinical review. Note! In the case where the event date form is excluded from Viedoc Clinic, then in Viedoc Reports - Review Status report, the 'Clinical Review by' will be marked as "N/A" (not applicable) since the form cannot be signed. |
| Description |
|---|
|
The date and time in UTC (Universal time coordinated) when the clinical review was performed. |
| Description |
|---|
|
The Username and ID of the user who performed the data review. Note! In the case where the event date form is excluded from Viedoc Clinic, then in Viedoc Reports - Review Status report, the 'DM Review by' will be marked as "N/A" (not applicable) since the form cannot be signed. |
| Description |
|---|
|
The date and time (UTC) when the data review was performed. |
| Description |
|---|
|
The Username and ID of the user who performed the source data verification (SDV). Note! In the case where the event date form is excluded from Viedoc Clinic, then in Viedoc Reports - Review Status report, the 'SDV by' will be marked as "N/A" (not applicable) since the form cannot be signed. |
| Description |
|---|
|
The date and time (UTC) when the SDV was performed. |
| Description |
|---|
|
The Username and ID of the user who signed the form. Note! In the case where the event date form is excluded from Viedoc Clinic, then in Viedoc Reports - Review Status report, the 'Signed by' will be marked as "N/A" (not applicable) since the form cannot be signed. |
| Description |
|---|
| The date and time (UTC) when the form was signed. |
| Description |
|---|
|
The Username and ID of the user who locked the form. Note! In the case where the event date form is excluded from Viedoc Clinic, then in Viedoc Reports - Review Status report, the 'Locked by' will be marked as "N/A" (not applicable) since the form cannot be signed. |
| Description |
|---|
| The date and time (UTC) when the form was locked. |
Notes!
The Missing data report shows the missing items. You can sort the data to focus on the review status by country, site, event, subject, form, or item, with the following columns showing, respectively:
by Country
by Site
by Event
by Subject
by Form
by Item
| Sub report | Description |
|---|---|
| Country | The number of subjects with at least one missing item. The number includes confirmed and unconfirmed items. |
| Site | |
| Event |
| Sub report | Description |
|---|---|
| Country | The number of forms with at least one missing item. The number includes confirmed and unconfirmed items. |
|
Site |
|
| Event | |
| Subject |
| Sub report | Description |
|---|---|
| Country | The number of required items within a saved form that are empty without a provided reason. Note! The required items are defined in the study design. |
|
Site |
|
| Event | |
| Subject | |
| Form |
| Sub report | Description |
|---|---|
| Country | The number of required items in a saved form left empty and have a provided reason. Note! The required items are defined in the study design. |
| Site | |
| Event | |
| Subject | |
| Form |
| Description |
|---|
| Either Missing data or Unconfirmed missing date. |
| Type | Description |
|---|---|
| Open | Includes queries Raised. |
| Removed | Includes queries Removed. |
| Resolved | Includes queries Resolved. |
| Closed | Includes queries Approved, Rejected, and Closed. |
| Description |
|---|
| User name and user ID of the user performing the query action and the reason for the query. |
The Pending forms report shows the pending forms*. You can sort the data to focus on the pending forms by country, site, event, subject, or form, with the following columns showing, respectively:
by Country
by Site
by Event
by Subject
by Form
*Note! Forms are considered pending when they are uninitiated in initiated events. This applies to all types of events, including subject-initiated events. For repeating forms, if the first instance of the form is uninitiated, the form is considered pending. Resetting a form results in that form being pending.
| Sub report | Description |
|---|---|
| Country |
The number of forms considered pending where forms are considered pending when they are uninitiated in initiated events. Note! This applies to all event types. |
| Site | |
| Event | |
| Subject |
| Sub report | Description |
|---|---|
| Country | The date the event was created (not the event date) only if several forms or subjects use the 'oldest' date. The date is in UTC. |
| Site | |
| Event | |
| Subject | |
| Form |
| Sub report | Description |
|---|---|
| Country |
Days since the event was created (not the event date). If forms or subjects use the 'oldest' date to calculate the Days pending, then time is not considered. Date is in UTC. |
| Site | |
| Event | |
| Subject | |
| Form |
| Sub report | Description |
|---|---|
| Country | The number of sites. |
| Sub report | Description |
|---|---|
| Country | The number of subjects with at least one pending form. |
| Site | |
| Event |
Note! Common events, the study start event, and hidden forms are not included in this report.
The Data entry cycle time report shows how long time it takes for the sites to enter form data. The data entry cycle time is the difference in days between the event date and the initiated date. The calculation is based on scheduled events only. You can sort the data to focus on the data entry cycle time by country, site, event, subject, or form, with the following columns showing, respectively:
by Country
by Site
by Event
by Subject
by Form
| Description |
|---|
| The event dates of the initiated events. |
| Description |
|---|
| The date the form was initiated. |
| Sub report | Description |
|---|---|
| Country | The days between the Event Date and the Initiated Date. Time is not factored into the difference. For all the sub reports, the average number of days is displayed rounded to one decimal, except for the sub report By form. |
| Site | |
| Event | |
| Subject | |
| Form |
| Sub report | Description |
|---|---|
| Country | The number of forms used to calculate the average Data Entry Cycle Time. |
| Site | |
| Event | |
| Subject |
The Medical coding report shows the coded data in the study. You can select reports for the dictionaries WHODrug, MedDRA, MedDRA_J, ATC without DDD, and IDF - each containing dictionary-specific columns.
Note! The Medical coding data can be downloaded at all times (via a standard report, sample download, or custom reports) regardless of the user permission set for the role in Viedoc Designer.
The medical coding report contains the following sub-reports:
Unique Term Report (UTR):
Use the UTR sub-reports to check the quality and consistency of your medical coding. Because the UTR is grouped and condensed, it is typically quicker to review than the standard coding export.
The report groups identical terms that are coded the same way into a single row, and shows how many cases share that coding.
If the same term is coded in different ways, it appears on multiple rows (one per coding), with a case count for each. This can indicate an issue in the coding that was selected.
Tip! To focus on potential issues, filter the Coding Discrepancy column.
Some columns and metrics are further defined below.
| Description |
|---|
| The number of coded terms. |
| Description |
|---|
| This displays merged identical codes into a single row, showing the number of cases associated with the code. If there are two different codes, they are shown in separate rows with their respective case counts. |
| Description |
|---|
| The last date coded for a particular term in UTC. |
| Description |
|---|
| The number of coded terms that are approved. |
| Description |
|---|
| The number of coded terms that are not approved. |
The Disposition report shows overviews of the current disposition status of the subjects across the study.
| Sub report | Description |
|---|---|
| Event (table by study) | The names of initiated events. (Common events are not included). |
| Event (table by country) | |
| Event (table by site) | |
| Event (plot by country) | |
| Event (plot by site) |
| Sub report | Description |
|---|---|
| Event (table by study) | The number of initiated events. For repeating event, the EventName is added onto the EventRepeatKey to distinguish each repetition. (Common events are not included). |
| Event (table by country) | |
| Event (table by site) | |
| Event (plot by country) | |
| Event (plot by site) |
| Sub report | Description |
|---|---|
| Subject status (table by Study) | The number of Subjects not Screened and not Completed and not Withdrawn. |
| Subject status (table by country) | |
| Subject status (table by site) | |
| Subject status (plot by country) | |
| Subject status (plot by site) |
| Sub report | Description |
|---|---|
| Subject status (table by Study) | The number of Subjects Screened and Withdrawn and not Enrolled. |
| Subject status (table by country) | |
| Subject status (table by site) | |
| Subject status (plot by country) | |
| Subject status (plot by site) |
| Sub report | Description |
|---|---|
| Subject status (table by Study) | The number of Subjects Screened and not Withdrawn and not Completed. |
| Subject status (table by country) | |
| Subject status (table by site) | |
| Subject status (plot by country) | |
| Subject status (plot by site) |
| Sub report | Description |
|---|---|
| Subject status (table by Study) | The number of subjects Completed as defined in the individual study design. |
| Subject status (table by country) | |
| Subject status (table by site) | |
| Subject status (plot by country) | |
| Subject status (plot by site) |
| Sub report | Description |
|---|---|
| Subject status (table by Study) |
The number of Subjects Withdrawn from a study, as defined in the study design. Note! When a subject has the status Withdrawn, the reasons for the withdrawal are displayed by ascending order with its respective count. |
| Subject status (table by country) | |
| Subject status (table by site) | |
| Subject status (plot by country) | |
| Subject status (plot by site) |
The Overdue events reports for the subreports ‘by Country', ‘by Site', ‘by Subject', ‘by Event’ shows the events that have the Proposed date and Event Window End Date set to a past date.
Below the tables is the following information:
Note!
You can sort the data to group by country, site, subject, event, or past proposed date, with the following columns showing, respectively:
by Country
by Site
by Subject
by Event
Past proposed date
Note!
| Sub report | Description |
|---|---|
| Subject | The subject status is defined in the study design. |
| Event | |
| Past proposed date |
| Sub report | Description |
|---|---|
| Country | The number of events that heave the "Event window end date" set to a date before the current date. |
| Site | |
| Subject |
| Sub report | Description |
|---|---|
| Event | The proposed date for the event. |
| Past proposed date |
| Sub report | Description |
|---|---|
| Event | The event window start date. |
| Past proposed date |
| Sub report | Description |
|---|---|
| Event | The event window end date. |
| Past proposed date |
| Sub report | Description |
|---|---|
| Event | Days since the Event Window End Date. |
| Sub report | Description |
|---|---|
| Past proposed date | The number of days until the Event Window End Date. This includes events with the proposed date in the past and the window end date in the future. |
The form status report gives an overview of the status of forms, for example, initiated, pending, completed, saved with issues, unsigned etc. You can sort the data to group by country, site, subject, event, or form, with the following columns showing, respectively:
by Country
by Site
by Subject
by Event
by Form
The report columns contain the following information:
| Sub report | Description |
|---|---|
| Subject | This is presented as defined in the individual study design. |
| Event | |
| Form |
| Sub reports | Description |
|---|---|
| Country | The number of forms that have been triggered. A form is triggered if it has been initiated or is pending. |
| Site | |
| Subject | |
| Event |
| Sub reports | Description |
|---|---|
| Country | The number of forms that have been initiated. |
| Site | |
| Subject | |
| Event |
| Sub reports | Description |
|---|---|
| Country | The number of forms that are pending. |
| Site | |
| Subject | |
| Event |
| Sub reports | Description |
|---|---|
| Country | The number of initiated forms that do not have any open issues. |
| Site | |
| Subject | |
| Event |
| Sub reports | Description |
|---|---|
| Country | The number of initiated forms that have at least one open issue. |
| Site | |
| Subject | |
| Event |
| Sub reports | Description |
|---|---|
| Country | The number of completed forms that are signed. |
| Site | |
| Subject | |
| Event |
| Sub reports | Description |
|---|---|
| Country | The number of completed forms that are not signed. |
| Site | |
| Subject | |
| Event |
| Sub reports | Description |
|---|---|
| Country | The number of initiated forms to the number of triggered forms. |
| Site | |
| Subject | |
| Event |
The Demographics summary report shows a table and a pie chart for the variables in the Demographics page.
(N = number of subjects)
The pie charts can be downloaded as a PNG file by clicking on the camera icon.
| Description |
|---|
| The total number of subjects in a study and at a site/s. |
| Description |
|---|
| The number of subjects completed as defined in the study design. |
| Description |
|---|
| The number of subjects withdrawn as defined in the study design. |
| Description |
|---|
| The number of subjects Screened and not Withdrawn and not Completed. |
| Description |
|---|
| The number of subjects not Screened and not Completed and not Withdrawn |
| Description |
|---|
| The number of EnrolledState 'Yes' selectees as defined in the study design. |
| Description |
|---|
| The number of EnrolledState records that are 'false'. |
The query reports show query data and statuses at different levels across the studies. They provide details on query metrics for Manual and Validation queries, Manual queries, Validation queries, and Pre-queries.
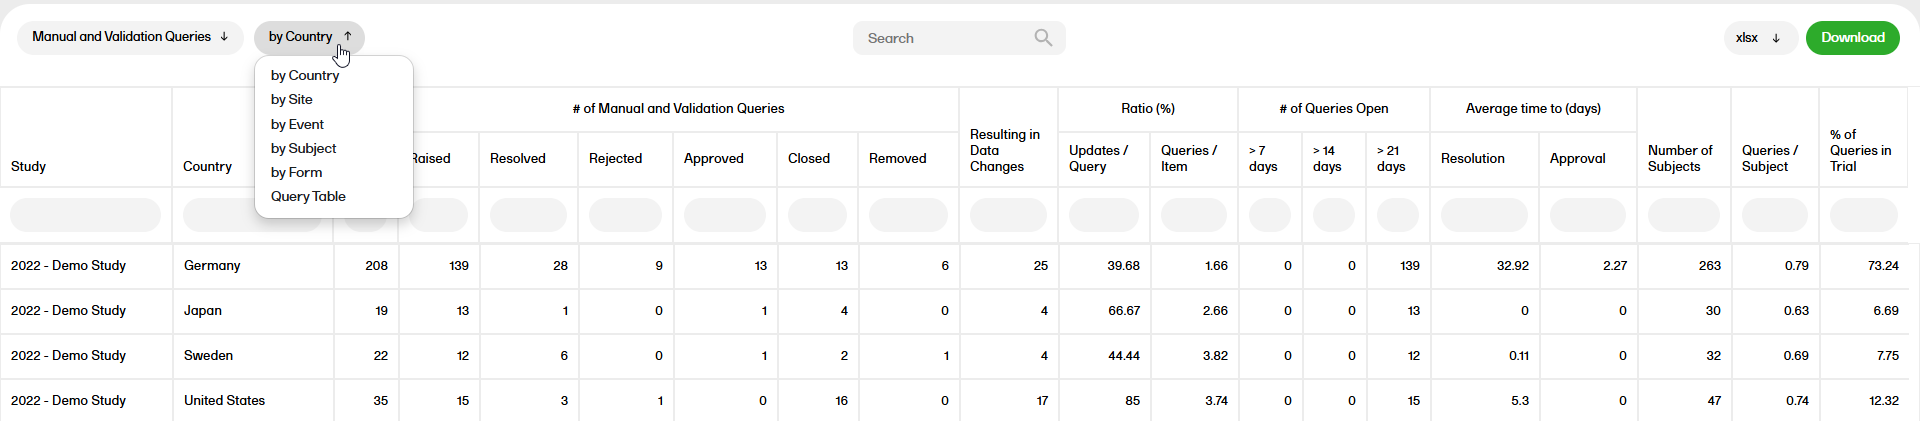
You can sort the data to focus on query status by country, site, event, subject, form or query table, with the following columns showing, respectively:
by Country
by Site
By Event
By Subject
By Form
Query Table
Note! Query table is the sub-report previously named Queries with the following columns showing:
Note! The Raised By column shows the queries raised by the Viedoc system or the name of the user who raised the query. The Raised On column shows the time and date the query was raised.
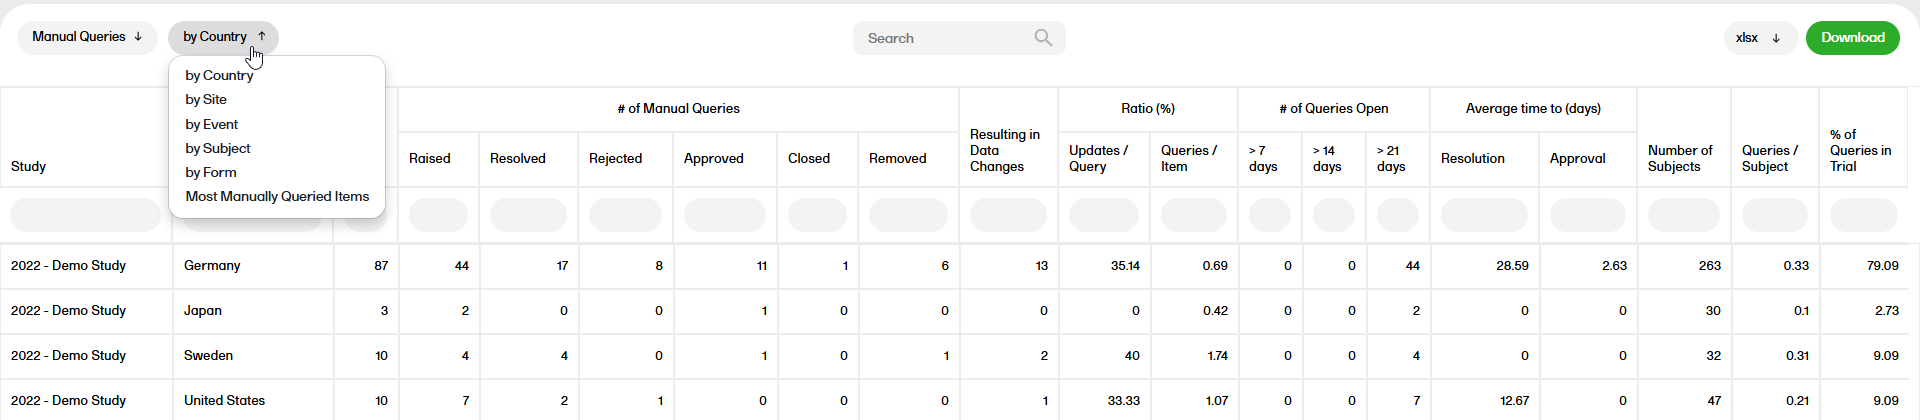
You can sort the data to focus on manual queries by country, site, event, subject, form or most manually queried items, with the following columns showing, respectively:
by Country
by Site
By Event
By Subject
By Form
Most manually Queried Items

You can sort the data to focus on validation queries by country, site, event, subject, form or most triggered validation queries, with the following columns showing, respectively:
by Country
by Site
By Event
By Subject
By Form
Most Triggered Validation Queries
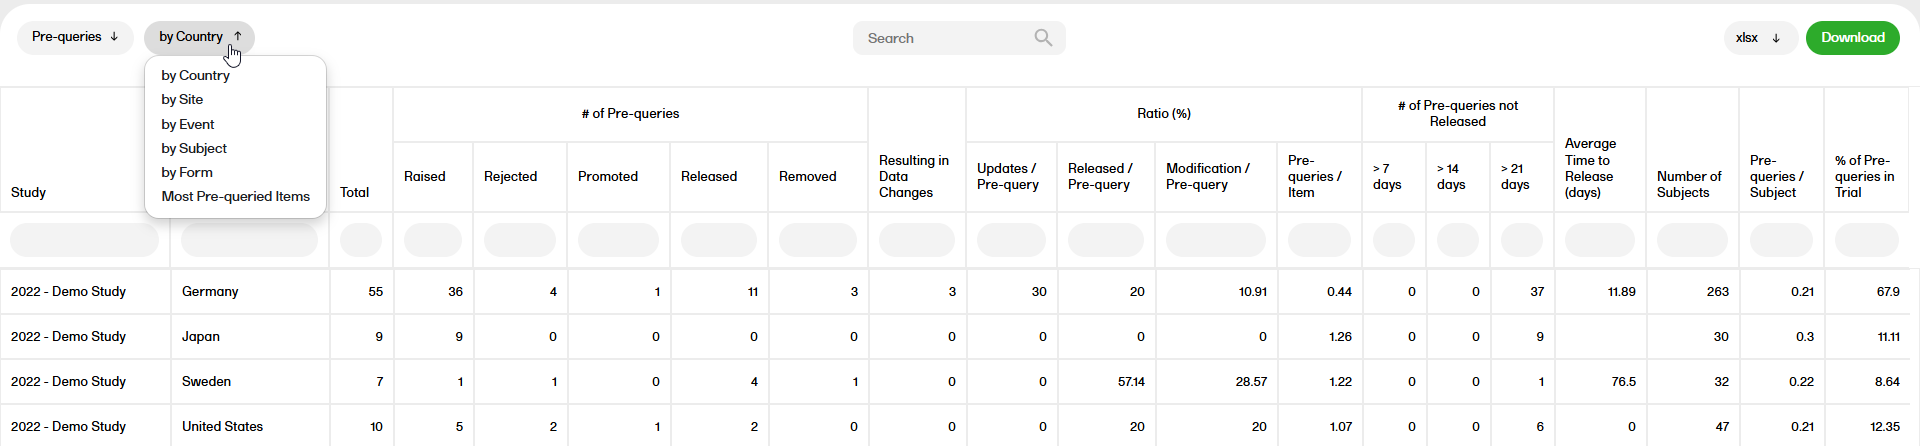
You can sort the data to focus on pre-queries by country, site, event, subject, form or most pre-queried items, with the following columns showing, respectively:
by Country
by Site
By Event
by Subject
By Form
Most Pre-queried items
Below you will find detailed descriptions of the different columns in the sub reports:
| Sub report | Field | Description |
|---|---|---|
| Country, Site, Event, Subject, Form | Raised | Number of queries/pre-queries in the raised state. |
| Country, Site, Event, Subject, Form | Rejected | Number of queries/pre-queries in the rejected state. |
| Country, Site, Event, Subject, Form | Approved | Number of queries in the approved state. |
| Country, Site, Event, Subject, Form | Closed | Number of queries in the closed state. |
| Country, Site, Event, Subject, Form | Removed | Number of queries/pre-queries in the removed state. |
| Country, Site, Event, Subject, Form | Promoted | Number of pre-queries in the promoted state. |
| Country, Site, Event, Subject, Form | Released | Number of pre-queries in the released state. |
| Sub report | Description |
|---|---|
| Country, Site, Event, Subject, Form | Total number of manual and validation queries/manual/validation/pre-queries |
| Sub report | Description | |
|---|---|---|
| Country, Site, Event, Subject, Form | Number of times a query/pre-query is resolved due to a data edit. | |
| Sub report | Field | Description |
|---|---|---|
| Country, Site, Event, Subject, Form | Updates / Query | Queries resulting in data changes / resolved+rejected+approved+closed queries. |
| Country, Site, Event, Subject, Form | Queries / Item | Number of total queries / Number of items entered in the CRF. |
| Country, Site, Event, Subject, Form | Updates / Pre-query | Number of times a pre-query is resolved due to a data edit / Number of raised pre-queries in a pre-query rejected/query resolved/query approved/query rejected/ query closed state. |
| Country, Site, Event, Subject, Form | Released / Pre-query | Number of released pre-queries for that subject / Total number of pre-queries for that subject. |
| Country, Site, Event, Subject, Form | Modification / Pre-query | Count of when a text is modified / Total number of pre-queries for that subject. |
| Country, Site, Event, Subject, Form | Pre-queries / Item | Total number of pre-queries for that subject / Total number of items entered in the CRF for that subject. |
| Sub report | Field | Description |
|---|---|---|
| Country, Site, Event, Subject, Form | > 7 days | Open queries with the duration in days of >7 and not >14. |
| Country, Site, Event, Subject, Form | > 14 days | Open queries with the duration in days of >14 and not >21. |
| Country, Site, Event, Subject, Form | > 21 days | Open queries with the duration in days of >21. |
| Sub report | Field | Description |
|---|---|---|
| Country, Site, Event, Subject, Form | > 7 days | Number of raised or promoted pre-queries, with the difference between the date the pre-query was raised raised and the system date > 7 and not >14. |
| Country, Site, Event, Subject, Form | > 14 days | Number of raised or promoted pre-queries, with the difference between the date the pre-query was raised raised and the system date > 14 and not >21. |
| Country, Site, Event, Subject, Form | > 21 days | Number of raised or promoted pre-queries, with the difference between the date the pre-query was raised raised and the system date >21. |
| Sub report | Field | Description |
|---|---|---|
| Country, Site, Event, Subject, Form | Resolution | The amount of time between a Query Raised to a Query resolved or Query closed. |
| Country, Site, Event, Subject, Form | Approval | The amount of time between a Query Resolved to a Query Approved or Query Rejected. |
Note!
| Sub report | Description |
|---|---|
| Country, Site, Event, Subject, Form | The average time to release for all pre-queries in the form if the pre-query is either released as query, rejected, or removed. |
Note!
| Sub report | Description |
|---|---|
| Country | Total number of subjects in that country. |
| Site | Total number of subjects in that site. |
| Sub report | Description |
|---|---|
| Country, Site | The total number of manual and validation/manual/validation queries in a country/site / the total number of subjects in a country/site. |
| Sub report | Description |
|---|---|
| Country, Site | The total number of pre-queries / the total number of subjects. |
| Sub report | Description |
|---|---|
| Country, Site | The total number of manual and validation/manual/validation queries in a country/site / the total number of queries in the study. |
| Sub report | Description |
|---|---|
| Country, Site | The total number of pre-queries in a country/site / the total number of pre-queries in the study. |
| Description | |
|---|---|
| The total number of manual and validation/manual/validation queries in a site / the total number of queries in the country. | |
| Description | |
|---|---|
| The total number of pre-queries in a site / the total number of pre-queries in the country. | |
| Description |
|---|
| The query study sequence number. |
| Type | Description |
|---|---|
| Manual and Validation Queries | Defines manually raised queries and automatically raised queries as a result of validation. |
| Validation | Defines automatically raised queries as a result of validation. |
| Manual | Defines manually raised queries. |
| Sub report | Field | Description |
|---|---|---|
| Country, Site, Event, Subject, Form, Query table, Pre-queries | Raised | Includes Raised queries |
| Country, Site, Event, Subject, Form, Query table, Pre-queries | Removed | Includes Removed queries |
| Country, Site, Event, Subject, Query table, Form | Approved | Includes Approved queries |
| Country, Site, Event, Subject, Form, Pre-queries | Rejected | Includes Rejected queries |
| Country, Site, Event, Subject, Query table, Form | Resolved | Includes Resolved queries |
| Country, Site, Event, Subject, Query table, Form | Closed | Includes Closed queries |
| Pre-queries | Promoted | Includes Promoted queries |
| Pre-queries | Released | Includes Released queries |
| Description |
|---|
| The text of the query message, applicable for both validation and manual queries. |
| Description |
|---|
| The username and user ID of the user who raised the query. |
| Description |
|---|
| The time in UTC (Coordinated Universal Time) when the query was raised. |
| Description |
|---|
| The username and user ID of the user who performed an action on the query. |
| Description |
|---|
| The time in UTC (Coordinated Universal Time) when the action was taken on the query. |
| Description |
|---|
|
Current query state, the name of the user who performed the changes, followed by the user ID in parentheses, and the text explaining a resolution, if one was entered. Note! Each query can have one or more rows. |
| Sub report | Description |
|---|---|
| Query table | The amount of time between a Query Raised to a Query Approved or a Query Rejected or a Query Closed. |
| Sub report | Description |
|---|---|
| Query table | The amount of days since a query was Raised (with no action taken on the query) to the current date. |
| Sub report | Description |
|---|---|
| Query table | The amount of days since a query was Resolved. The amount of days between when the query is resolved until the current date for all queries that are Resolved, that is, not yet actioned by the query reviewer. |
| Sub report | Description |
|---|---|
| Query table | The Query Resolution text from the current Query Status. |
| Sub report | Description |
|---|---|
| Query table | The amount of time between a Query Raised to a Query resolved or Query closed. |
| Sub report | Description |
|---|---|
| Query table | The amount of time between a Query Resolved to a Query Approved or Query Rejected. |
| Description | ||
|---|---|---|
| The item on which a query is raised. |
| Sub report | Description |
|---|---|
| Most Manually Queried Items Most Triggered Validation Queries |
Total number of queries. |
| Sub report | Description |
|---|---|
| Most Pre-queried Items | Total number of prequeries |
| Sub report | Description |
|---|---|
| Most Pre-queried Items | Number of prequeries in the raised and promoted state |
| Sub report | Description |
|---|---|
|
Most Manually Queried Items |
Number of queries with the status Raised. |
| Most Pre-queried Items | Number of pre-queries in raised state which are released from prequery state |
| Sub report | Description |
|---|---|
|
Most Manually Queried Items |
Number of times a query/pre-query is resolved due to a data edit. |
| Sub report | Description |
|---|---|
| Most Triggered Validation Queries | Consists of the actual query text. |
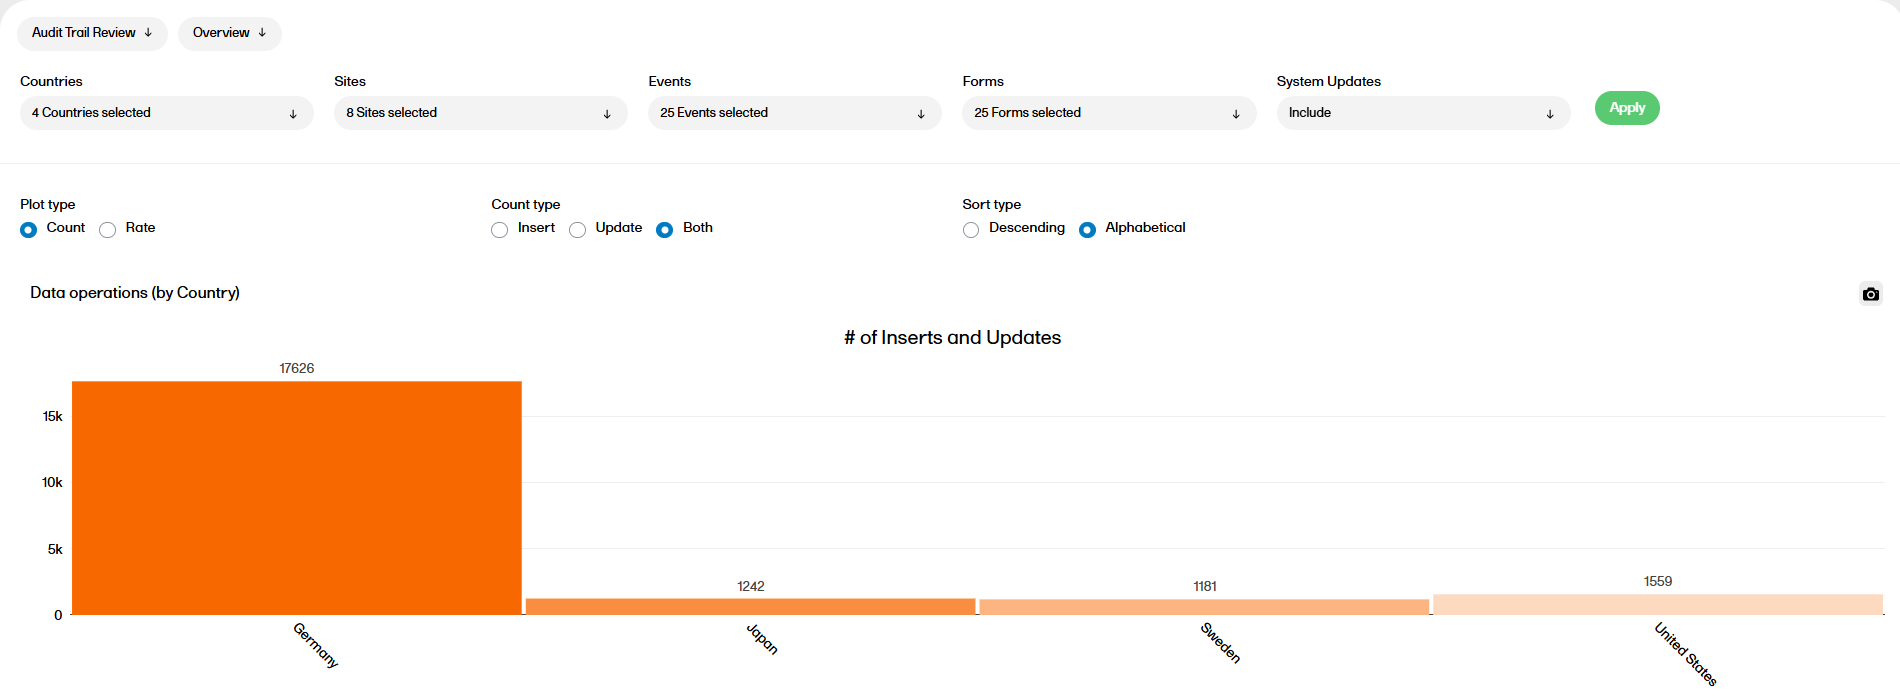
The Audit Trail Review (ATR) report shows divergences to the normal data entry pattern as well as the general performance.
This report has two sub reports, Overview and Change over time that are described below.

The following settings can be configured in the Overview sub report:
Filters:
Plot type and Rate type:
Sort type:
You can now see the data operations by country, site, event, and form. You can also see the data operations by item (top 20), which only appears if plot type Count is selected.
Insert: For the grouping Subject, Event, Activity, Form, Item the first entry is called 'Insert'.
Update: For the same grouping the other entries are called 'Update'.
System Updates: Records that are of OperationType 'Update' and the EditBy is 'System(0)' are considered as System Updates
Rate by Item is number of Updates/ number of Inserts (per item, subject event, etc. based on plot viewing) rounded to the 2nd decimal.
Rate by Subject is number of Updates (per item, subject, event, etc. based on plot viewing)/ count of Subjects rounded to the 2nd decimal.
Rate by Item: The Line value is calculated as sum of number of Updates / sum of number of Inserts at a study level rounded to the 2nd decimal.
Rate by Subject : The line value is calculated as sum of number of Updates/ count of total subjects in the study rounded to the 2nd decimal.
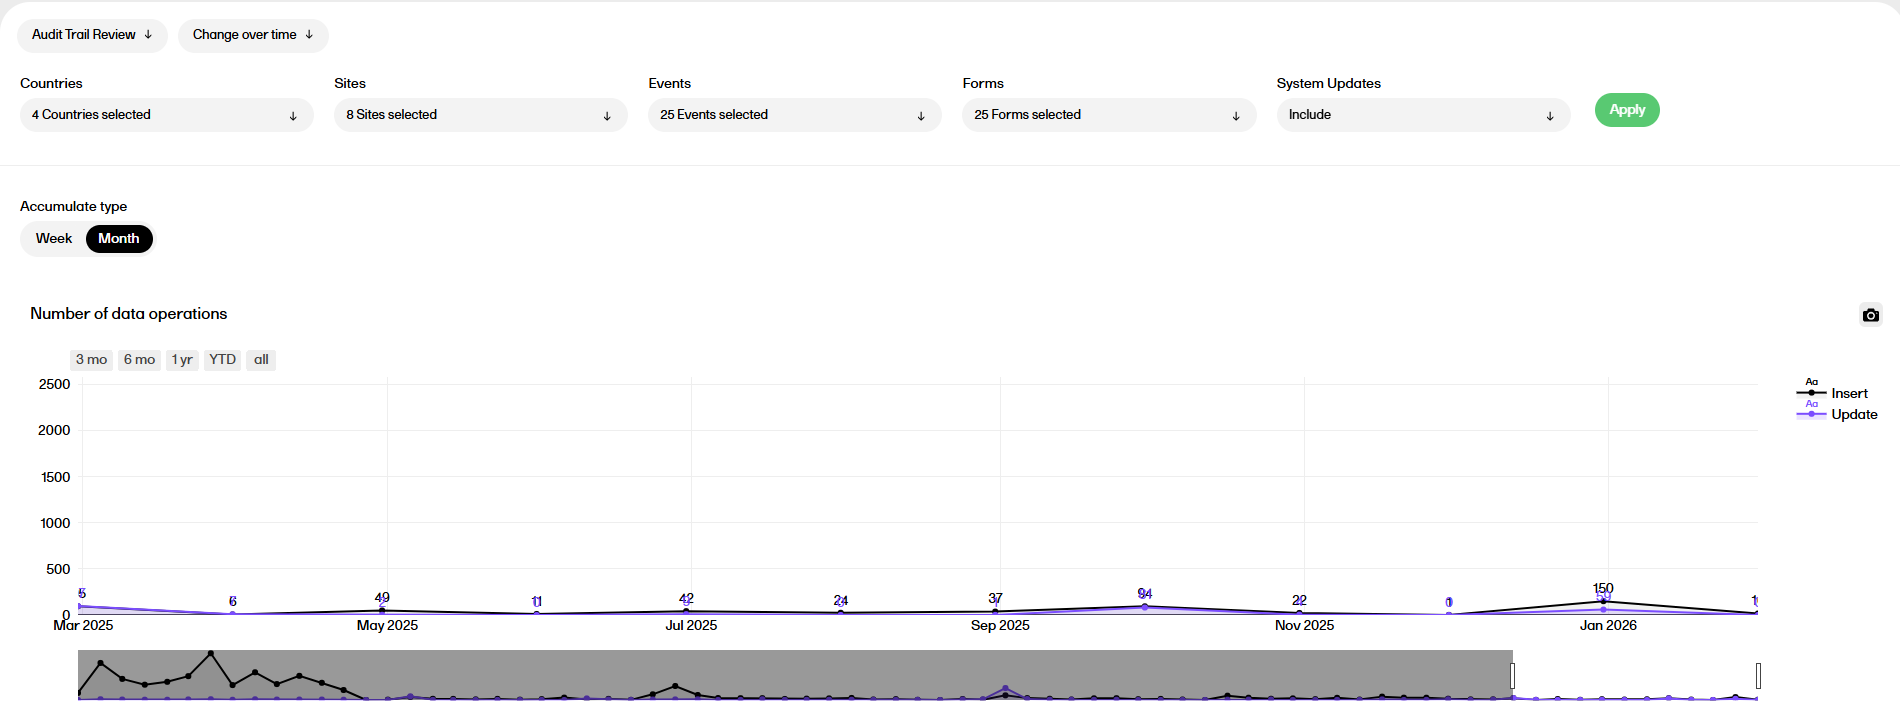
The following settings can be configured in the Change over time sub report:
Filters:
Accumulate type:
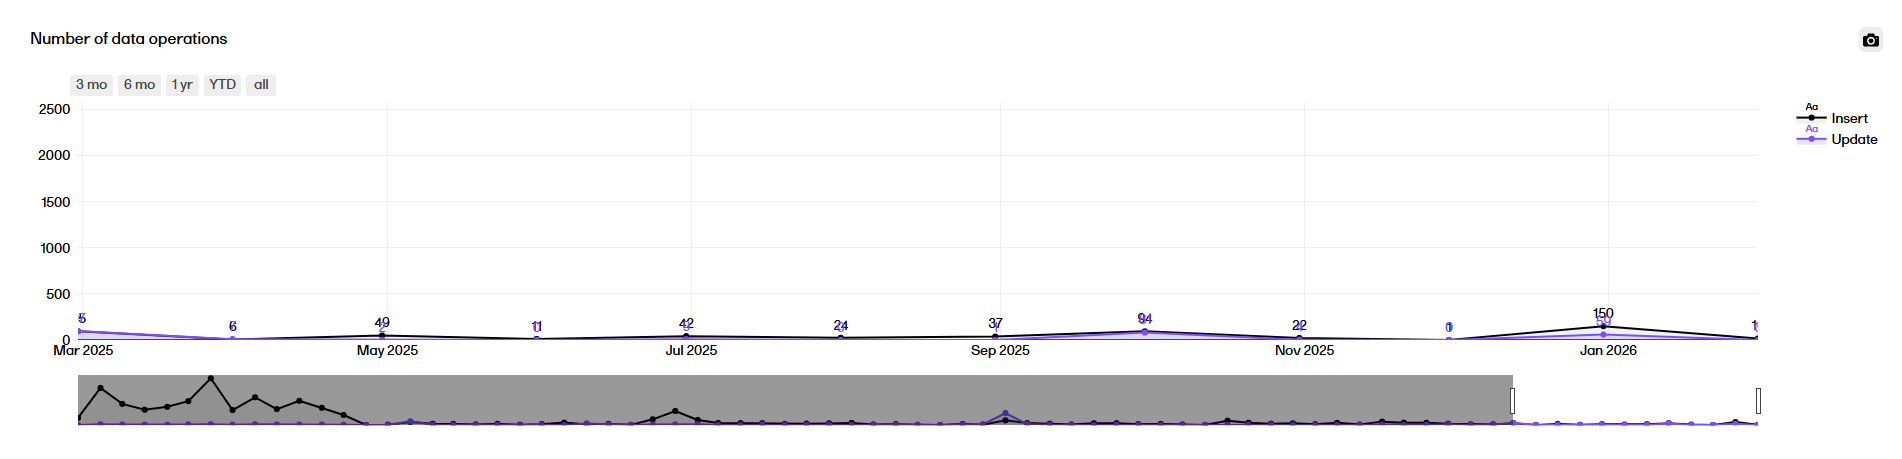
There are two plots in the Change over time sub report, Number of data operations and Cumulative number of data operations. Both plots are described below.
Features common to both plots:
Number of data operations plot
The Number of data operations plot displays a timeline across the study start until now, rendering the number of Inserts/Updates accumulated between each time point.
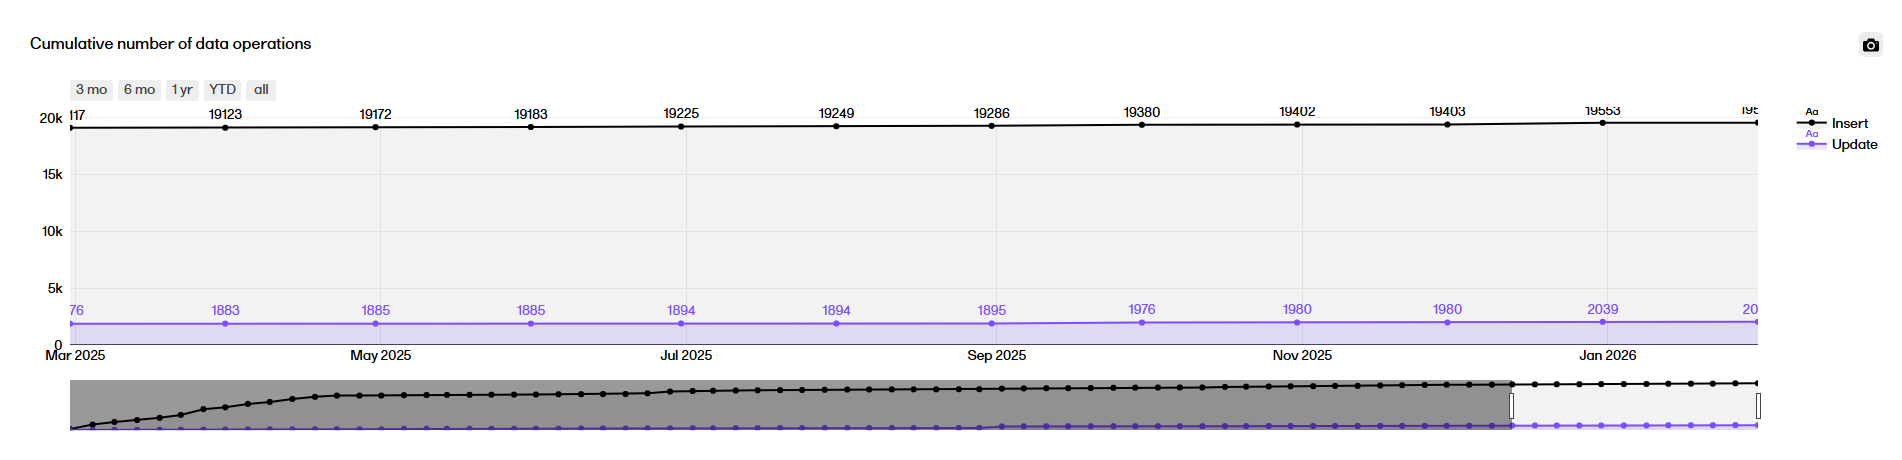
 Cumulative number of data operations
The Cumulative number of data operations plot displays a timeline across the study start until now, rendering the cumulative number of Inserts or Updates done since the start of study up until that time point.
The Key risk indicator (KRI) report gives you a quick overview of the key risk indicators per site. This report has three sub reports: Overview, by Site, and by Key risk indicator.
The KRI values are based on calculations of:
Note! UTC is the standard in all calculations using date and time.
The following KRI values can be shown in the reports:
eCRF Data entry lag
Fetches the timelapse days for each form.
The Site value is the average number of timelapses across all forms in a site.
Note! The logic for the eCRF data entry lag calculation is as below:
Overdue events per subject
Calculates the average number of overdue events for each subject.
The Site value is the average number of overdue events per subject for each site.
Overdue events is not shown if there are no overdue events in the study.
Pending forms per subject
Calculates the average number of pending forms for each subject.
The site value is the average number of pending forms per subject for each site.
Pending forms is not shown if there are no pending forms in the study.
Data changes per form
Fetches the number of updates for each form.
The Site value is the average number of updates across all forms in a site.
Note! System updates for the Data changes per form are not considered. Also, we only consider the updates but not the initial entry for the calculation.
Signature lag (in days)
Calculates the signature lag (in days) for each form. This is calculated as the number of days between the last edit date and time and signature date and time.
This is calculated only when there are signed forms in the study.
Note! The signature lag is calculated as below:
AE - # of AE for each subject
This is calculated only if the AE module is defined.
Calculates the number of AE for each patient (one record per patient, with frequency of AE).
The Site value is the average number of AEs across all subjects in a site.
DOR% (drop out rate)
Calculates the drop out rate.
The Site value is the number of dropout subjects multiplied with 100 divided with the number of enrolled subjects.
For more information about the DOR% select this link.
SFR% (screening failure rate)
Calculates the screening failure rate.
The Site value is the number of screen failed subjects multiplied with 100 divided with the number of screened subjects.
Note! The screen failure rate is based on the following subject status definition in Viedoc Designer: ScreenFailed - if WithdrawnState = TRUE and EnrolledState != TRUE
Open Queries per subject
Calculates the number of queries for each subject.
The Site value is the average number of open queries across all subjects in a site (missing data and pre-queries are excluded).
Processed Queries per subject
Calculated as # resolved, closed, rejected or approved queries / # of Subjects
The Site value is the average number of resolved, closed, rejected or approved queries across all subjects in a site (missing data, pre-queries, and removed queries are excluded).
Rejected queries per subject
Calculates the number of rejected queries for each subject.
The Site value is the average number of queries with query status as rejected per subject for each site (pre-queries are excluded).
Rejected queries is not shown if there are no rejected queries in the study.
Time to query resolution (in days)
Calculated as sum of 'Open to Resolved Days'* or if missing, 'Open to Closed Days'*/'#Closed queries' (pre-queries and Removed queries are excluded).
The Site value is the average number of days is took between query raised day to query closed day across all queries in a site.
Confirmed missing per subject
Calculated as '#Confirmed missing items'* / '# of Subjects'
The Site value is the average number of confirmed missing data across all subjects in a site.
Unconfirmed missing per subject
The same as "Open Queries per subject" (but only for Unconfirmed missing).
The Site value is the average number of unconfirmed missing data across all subjects in a site.
The Study mean and Study deviation is the average and standard deviation of the Site value across all sites.
The Key Risk Indicators report has three sub reports, Overview, by site, and by Key Risk Indicator, which are described below.
The Overview sub report shows a table with one record per site, with the columns Study Name, Country, Site Code, Site Name, # of subjects, and Key Risk Indicators. The circles represent the KRI with severity going from green to yellow to red. You can hover over each circle to see the KRI.

In the by Site sub report, you can select a site to see a pie chart with the KRI status for that site. Below the chart you can also see a table with more details about the KRI, showing the Study Name, Country, Site Code, Site Name, Key Risk Indicator, Site Value, Study Mean, Study Deviation, and Thresholds.
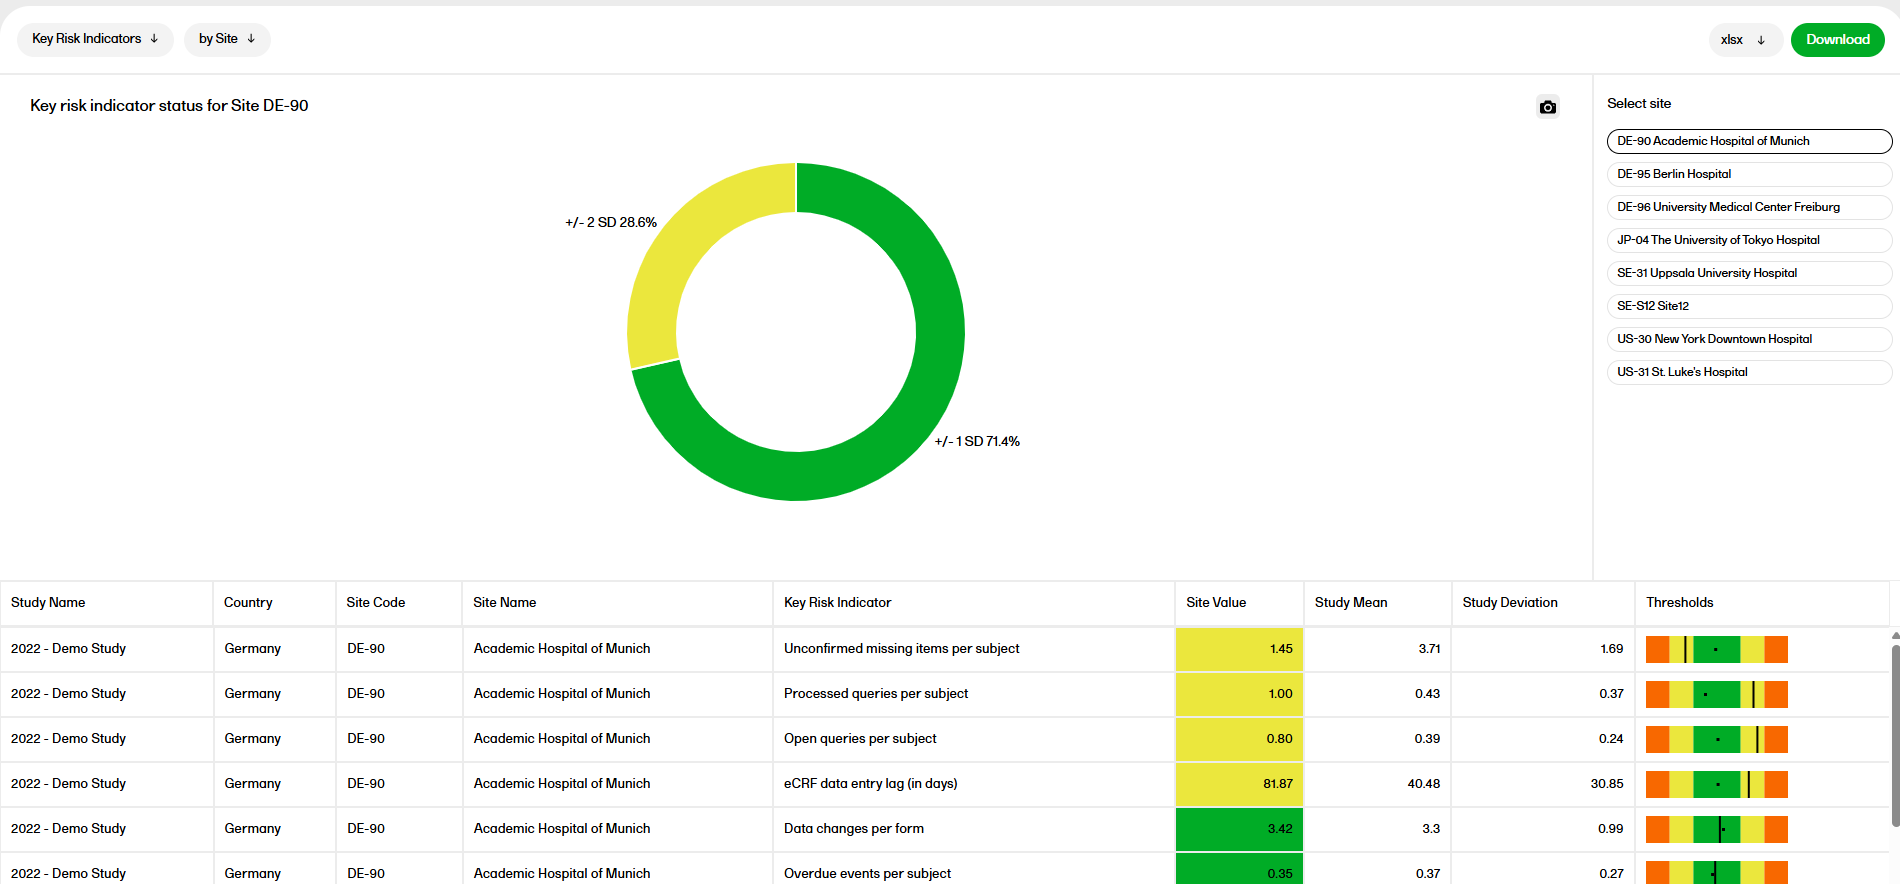
Metrics:
SD = Standard deviation
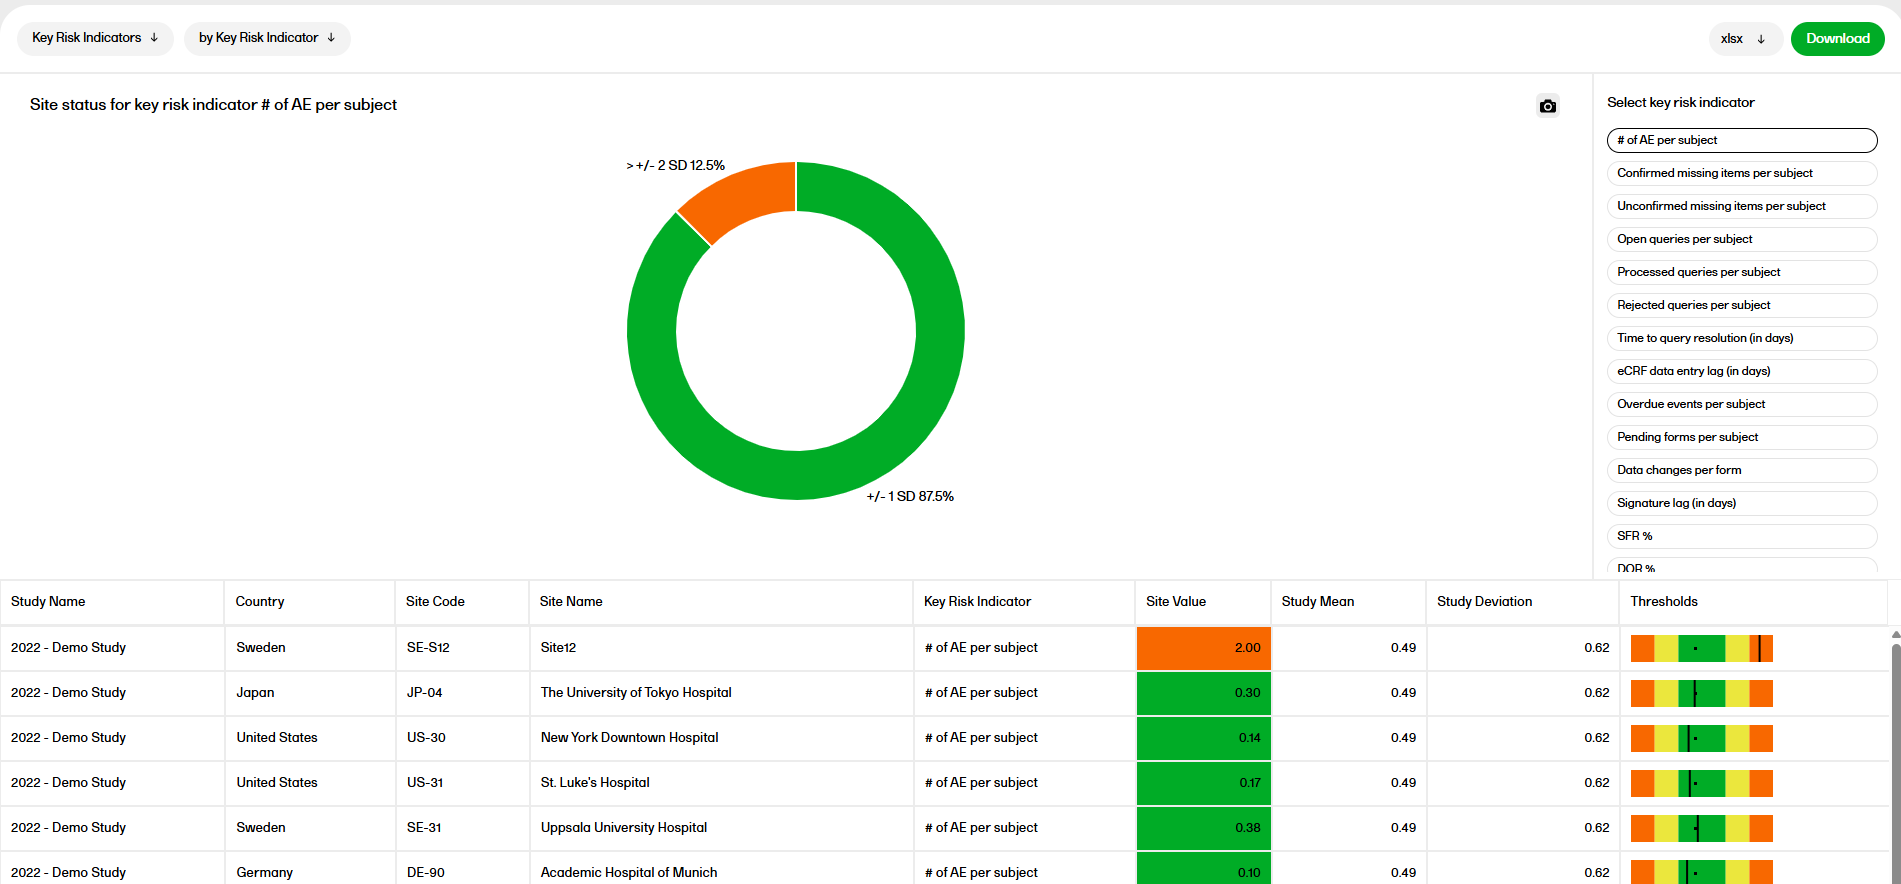
Metrics:
SD = Standard deviation
The custom reports are written in the programming language R that generates report tables and plots based on CRF and operational data. The R program can be re-used from study to study and is uploaded in Viedoc Designer.
The visibility of the custom reports can be controlled by role, so that dedicated reports can be created for different roles, for example Monitor, Project Manager, or Sponsor. This means that the custom report can only consist of data existing within the scope of the current study and user role.
The data in the custom reports is updated with every data sync, just like any other report in Viedoc Reports.
TIP! Find downloadable example report scripts and practical R examples for visualizing and analyzing Viedoc data in the custom-reports repository in Viedoc's Github. The scripts can be customized adapted to your study’s needs.
The current version of the R program is 4.0.4.
For information on accessing the available R packages and which versions are supported, please see the description for the SampleReportCode.R file below.
Reports always use the latest export version. If a new export version is released, users should check the Release Notes to determine if or how their reports or custom reports are affected.
Comment: this text about the data export version exists in overview of Viedoc reports, reports, and creating custom reports lessons.
A .zip package for creating custom reports is downloaded from the Settings menu, found in the upper right corner of Viedoc Reports.
This package is only available for users with access to the Reports page and have export permission and the export permission is applicable to all of the assigned sites..
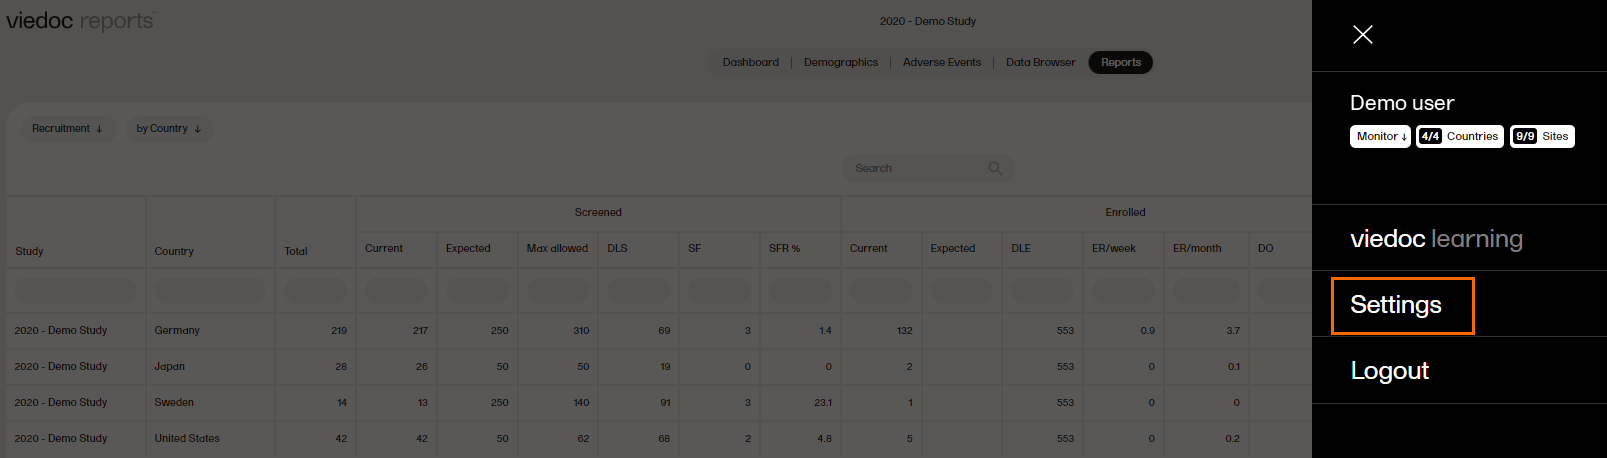
By clicking Download data for custom reports, and following the instructions on the screen, the .zip package is downloaded to your computer.

The .zip package consists of the following files that are to be used as support when writing your custom reports:
| Important! The sample data provided in the edcData.rds file may include sensitive data, only authorized persons should have access to this data.. |
|
edcData.rds |
This file contains sample data from the study, including CRF data and operational data, such as queries, processedqueries, reviews, signature, database lock, timelapse, and so on. |
|
params.rds |
This file includes these items:
The list of sites in the "Site Level Data" is based on the user’s access to the study. |
|
This is a sample report with explanations of the report structure. The code is a sample to give an idea to the user on how to write a report code, its corresponding inputs, and the structure of the output. This file also contains a list of R packages available for the user. Supported R packages: For information and a code snippit to show available R packages, open this file, scroll down to find a section called "Sample Code". This code snippit can be used to generate a custom report which identifies available R packages and versions supported by custom reports. |
|
|
utilityFunctions.R |
This file contains various functions that can be used when writing the custom report. |
When finished, the R file uploads in the Global design settings of Viedoc Designer. For more information, see Configuring Viedoc Reports. The custom report is then selectable for users with permissions to see it in Viedoc Reports.
As part of the edcData.rds, the dataset "ProcessedQueries" is included. See the table below for more information:
| Columns | Labels | Logic |
|---|---|---|
| QueryStudySeqNo | Query study sequence number | |
| SiteSeq | Site sequence number | |
| SiteName | Site name | |
| SiteCode | Site code | |
| SubjectSeq | Subject sequence number | |
| SubjectId | Subject Id | |
| EventSeq | Event sequence number | |
| EventId | Event Id | |
| EventName | Event name | |
| EventDate | Event date | |
| ActivityId | Activity Id | |
| ActivityName | Activity name | |
| FormId | Form Id | |
| FormName | Form name | |
| FormSeq | Form sequence number | |
| SubjectFormSeq | Subject form sequence number | |
| OriginSubjectFormSeq | Origin Subject form sequence number | |
| SourceSubjectFormSeq | Source Subject form sequence number | |
| ItemId | Item Id | |
| ItemName | Item | |
| QueryItemSeqNo | Query item sequence number | |
| RaisedOn | Raised on | |
| QueryType | Query type | |
| RangeCheckOID | Range check OID | |
| QueryText | Query Text | |
| PrequeryText | Prequery Text | Query text for the prequery raised |
| UserName | User Name | Username for the person who raised the query/ who left the field blank |
| QueryResolution | Query Resolution | |
| ClosedByDataEdit | Query closed due to data edit | Value is 'Yes', if on filtering Queries EDC where a single query can have multiple records, the text 'Query closed due to data edit' is present for any Query State in Query Resolved, Query Rejected, Query Approved, Query Closed. |
| QueryResolutionHistory | Response comments | |
| QueryStatus | Current Query Status | |
| PrequeryPromoted | Prequery Promoted On | Date value |
| PrequeryPromotedBy | Prequery Promoted By | Username value |
| PrequeryRaised | Prequery Raised On | Date value |
| PrequeryRaisedBy | Prequery Raised By | Username value |
| PrequeryRejected | Prequery Rejected On | Date value |
| PrequeryRejectedBy | Prequery Rejected By | Username value |
| PrequeryRemoved | Prequery Removed On | Date value |
| PrequeryRemovedBy | Prequery Removed By | Username value |
| QueryApproved | Query Approved On | |
| QueryApprovedBy | Query Approved By | Username value |
| QueryClosed | Query Closed On | |
| QueryClosedBy | Query Closed By | Username value |
| QueryRaised | Query Raised On | |
| QueryRaisedBy | Query Raised By | Username value |
| QueryRejected | Query Rejected On | |
| QueryRejectedBy | Query Rejected By | Username value |
| QueryRemoved | Query Removed On | |
| QueryRemovedBy | Query Removed By | Username value |
| QueryResolved | Query Resolved On | |
| QueryResolvedBy | Query Resolved By | Username value |
| QueryClosed_C | Query Closed_C | |
| OpenQueryAge | Age of Open Query (Days) | Difference between the Query Raised date and current date for query in 'Query Raised' state; |
| ResolvedQueryAge | Age of Resolved Query (Days) | Difference between the Query Resolved date and current date for query in 'Query Resolved' state |
| PrequeryAge | Age of Unreleased Prequery (Days) | Difference between the Prequery Raised date and current date for prequery in 'Prequery Raised' or 'Prequery Promoted' states |
| TimeToResolution | Days To Resolve/Close | Difference between the Query Raised date and Query Resolved/ Query Closed date |
| TimeToApproval | Days To Approve/Reject from Resolve Stage | Difference between the Query Resolved date and Query Approved/ Query Rejected date; |
| TimeToRelease | Days to Release/Reject/Remove Prequery | Difference between the Prequery Raised date and Prequery Rejected/Removed/Released(Query Raised) date |
| TimeofQueryCycle | Time of Query Cycle (Days) | Difference between the Query Raised date and Query Approved/ Query Rejected/ Query Closed date |
| TimeToRemoval | Days to Remove | |
| RaisedMonth | Raised Month | |
| ResolvedMonth | Resolved Month | |
| RemovedMonth | Removed Month | |
| LatestActionBy | Latest Action By | Username value |
| LatestActionOn | Latest Action On | Date value |
The ProcessedQueries dataset will be updated to include the new columns only when there is a new sync with the EDC. For production studies this happens automatically every day, as long as there has been a data change. For training studies, and for production studies without data modification in the past 24 hours, there will be no automatic data sync. As soon as the data is synced after the release, the new columns in the ProcessedQueries dataset are populated correctly and the standard reports using data will also display correctly.
Until the data has synced, the new Queries reports, and other reports that use data from the ProcessedQueries dataset, such as Missing Data, Form Status, PMS, and KRI will result in error/incorrect data. This is because they use the old ProcessedQueries data from Viedoc 4.79 and earlier, which would not have the required columns/column values for populating all reports.
Viedoc supports using the programming language R for custom reports. This lesson lists several custom reports written for our template studies or any studies that follow the Clinical Data Acquisition Standards Harmonization (CDASH) standards. For instructions about how to add custom reports, see Creating Custom Reports.
TIPS!
Details and example images of each report are shown below:
This report displays all ongoing adverse events. This demonstrates a good example of how to filter data based on specific criteria, as well as how to create a report with two sub-reports.
This custom report generates the following output:
Sub-report 'Ongoing AEs': A table of all adverse events (AEs) that are ongoing, sorted by start date (ascending).
Sub-report 'Start Date > 30 days': A table of ongoing AEs with a start date of more than 30 days ago.
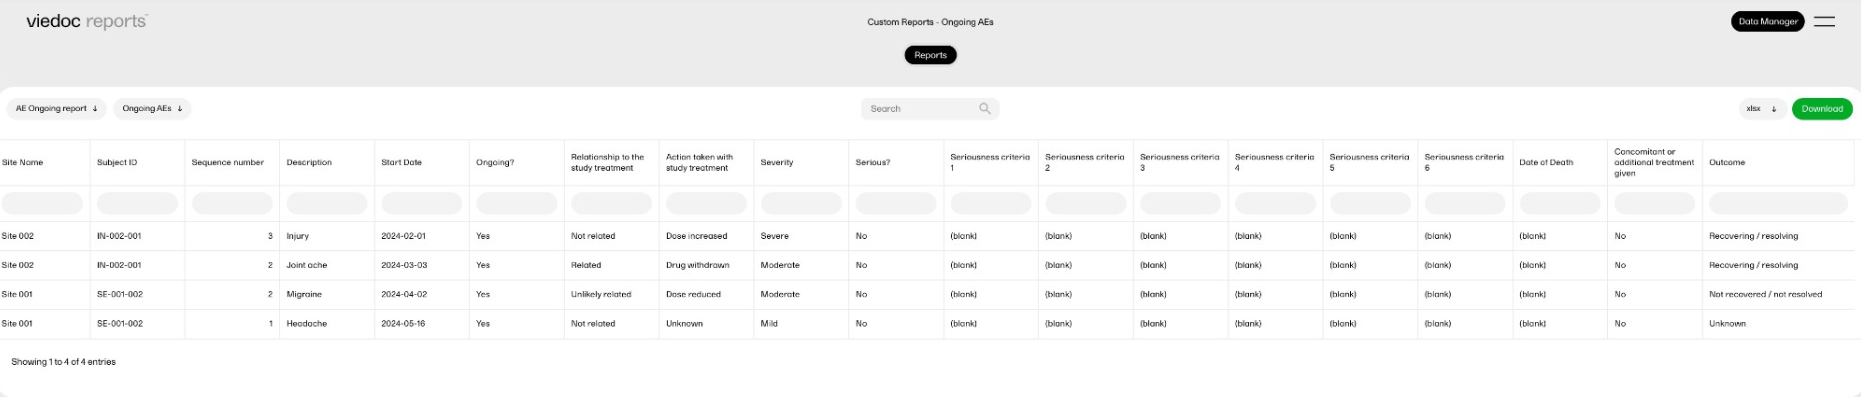
This report displays selected data consisting of adverse events (AEs) that were recorded as treatment-related and serious, and summarizes the data by site.
This custom report generates the following output:
Sub-report 'by Subject': A table of all AEs entered as possibly related to the study treatment and as Serious.
Sub-report 'by Site': A table of the number of AEs fulfilling the above criteria per site.
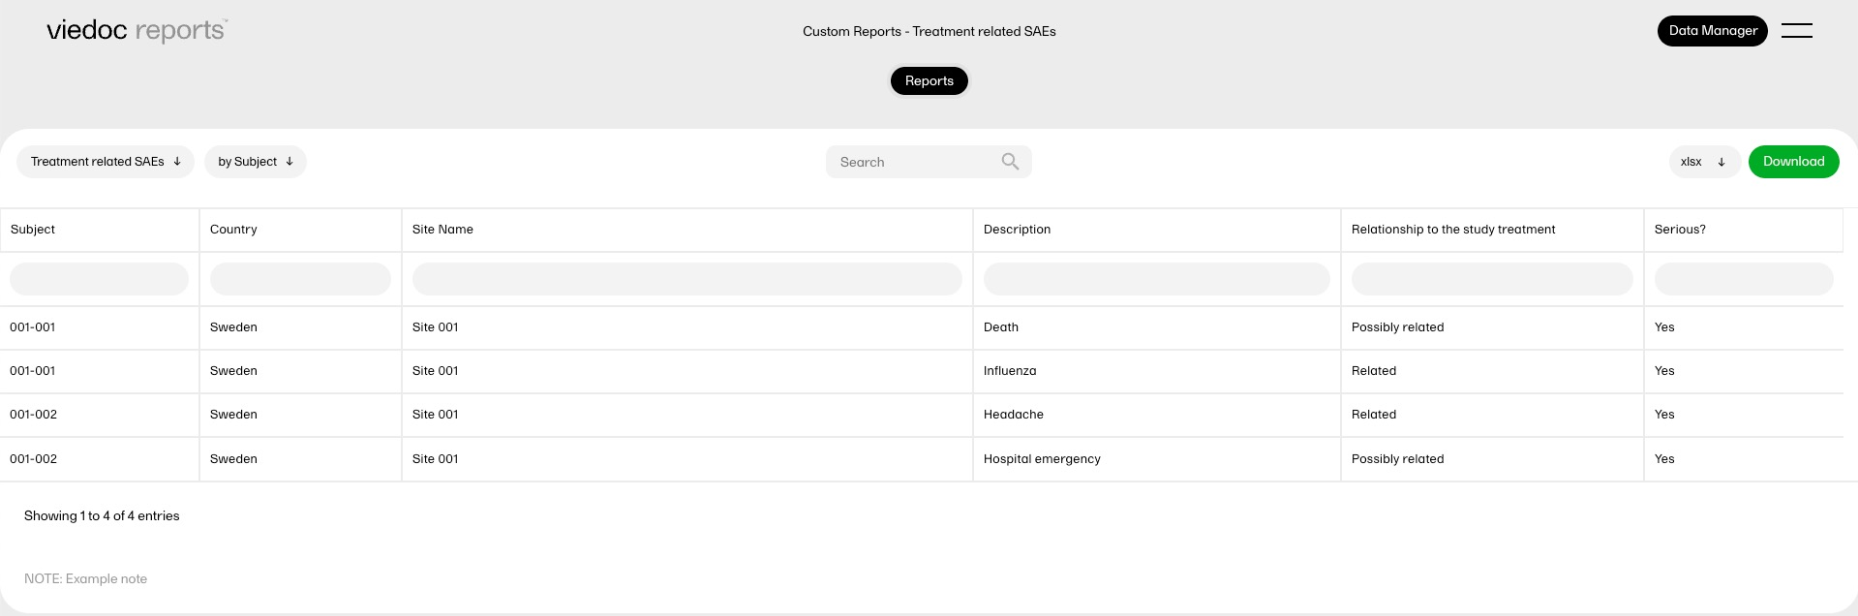
This report displays all the serious adverse events (SAEs) with the corresponding demographic data. It is an example of how data from two different forms can be combined into a single custom report, as well as flag missing data.
This custom report generates the following output:
A table of AEs entered as Serious, combined with the subject's sex and age from the demographic form.
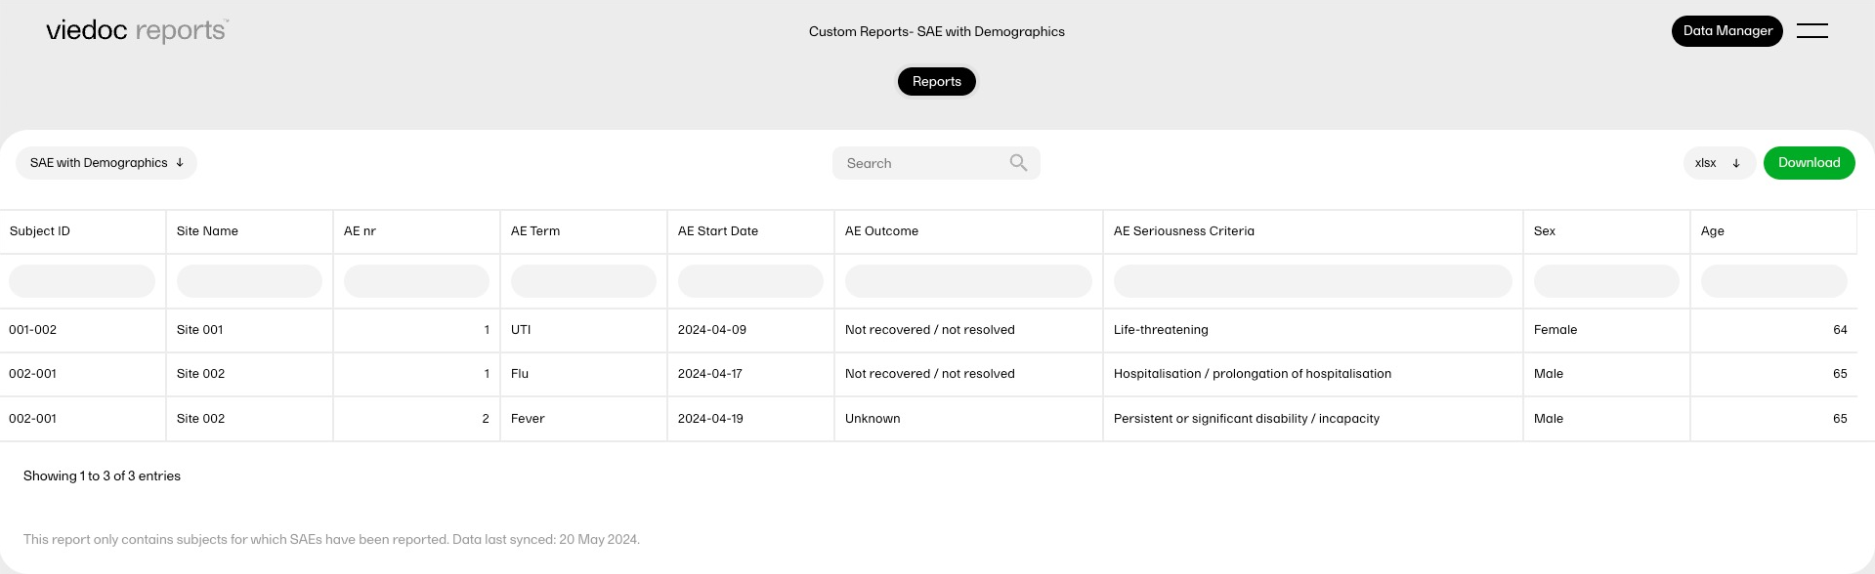
This report displays statistical outliers identified in the data.
This custom report generates the following output:
Sub-report 'Systolic BP': A table listing outliers in the systolic blood pressure data.
Sub-report 'Diastolic BP': A table listing outliers in the diastolic blood pressure data.
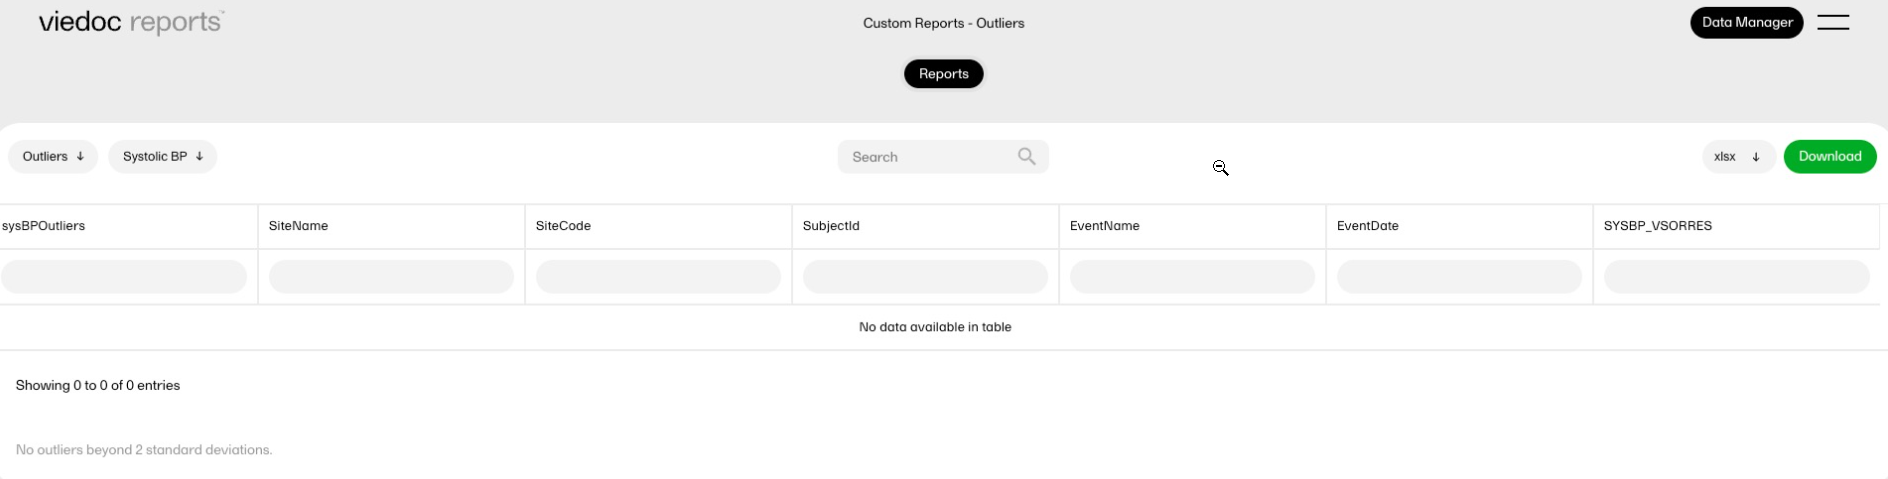
This report calculates the drug accountability between two visits, and displays the calculated values in new columns. It demonstrates how a custom report could be used to calculate scores or other metrics.
This custom report generates the following output:
A table of allocated and returned kits with the expected and the actual returned numbers of tablets.
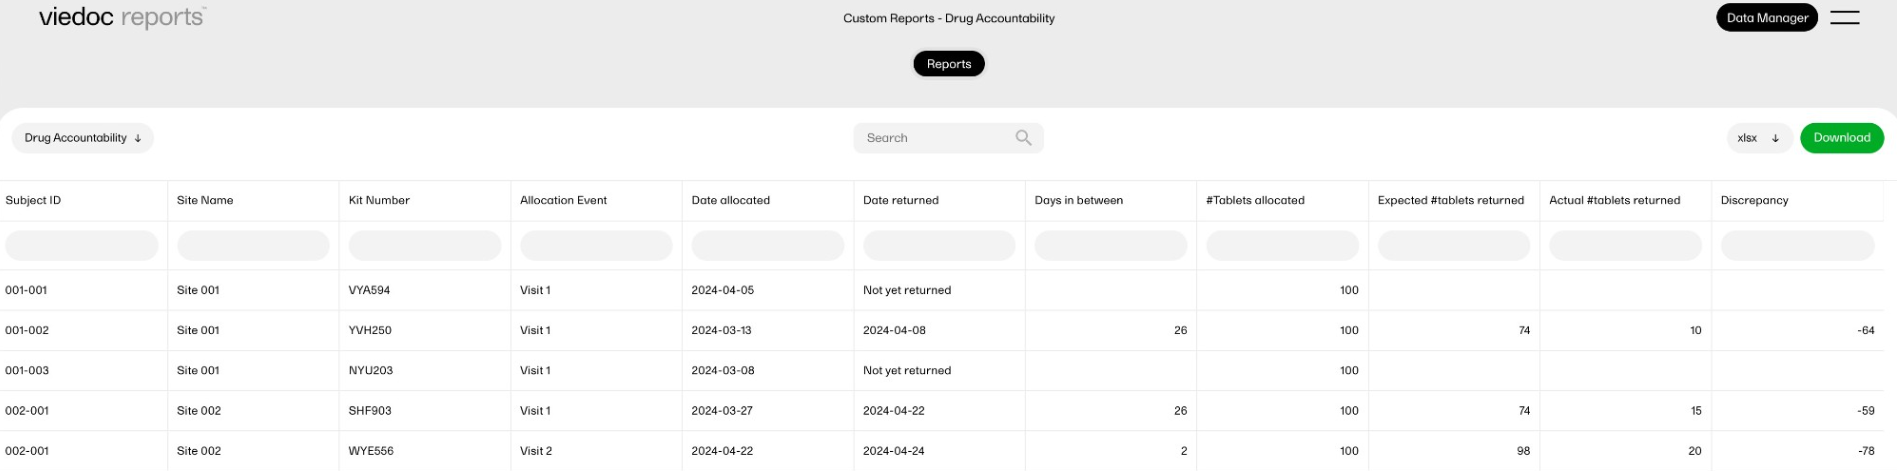
This report compares AEs with concomitant medication (CMs) to check for inconsistencies in data entry. This is something that previously was an offline check that required a manual comparison of the data. This custom report provides a list of the problematic data immediately.
This custom report generates the following output:
Sub-report 'CMs linked to AEs where no meds were prescribed': A table showing the concomitant medication (CMs) entries that are linked to the adverse events entries in which it was reported that no treatments or medications were prescribed.
Sub-report 'AEs where meds were prescribed not linked to CMs': A table showing adverse events entries for which it was reported that treatments or medications were prescribed, but for which no concomitant medications entry exists.
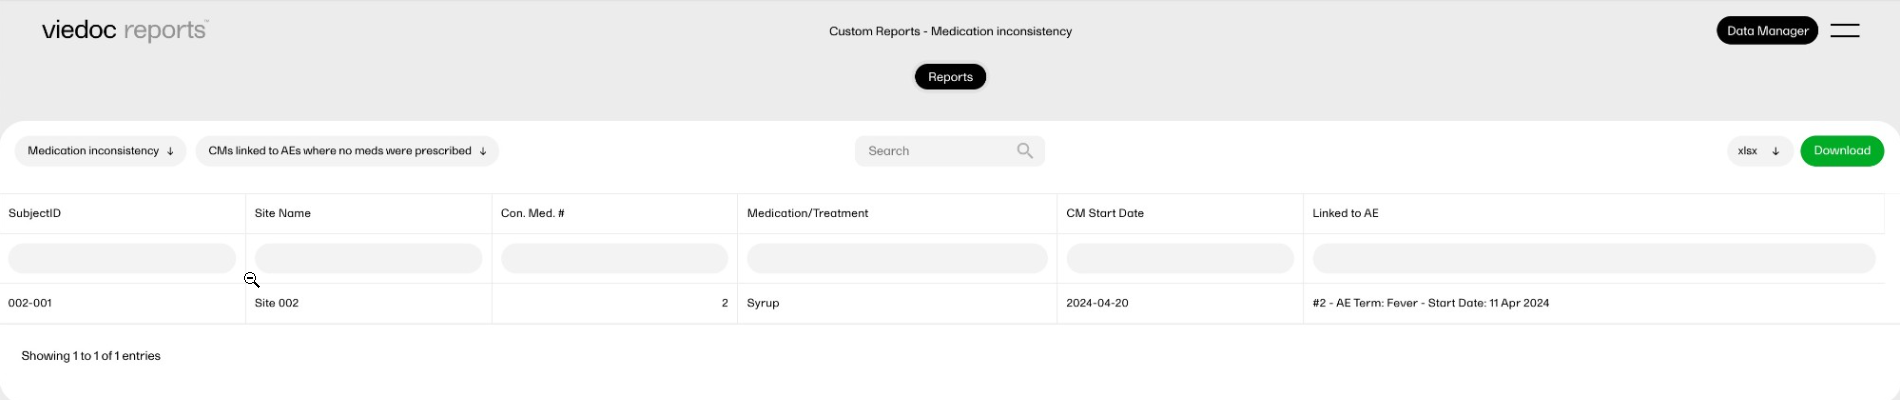
This report displays simple scatter plots using the 'plotly' package.
This custom report generates the following output:
Sub-report 'Mean Arterial Pressure' (MAP): A plot of the calculated MAP.
Sub-report 'Systolic only': A plot of the systolic blood pressure.
Sub-report 'Diastolic only': A plot of the diastolic blood pressure.
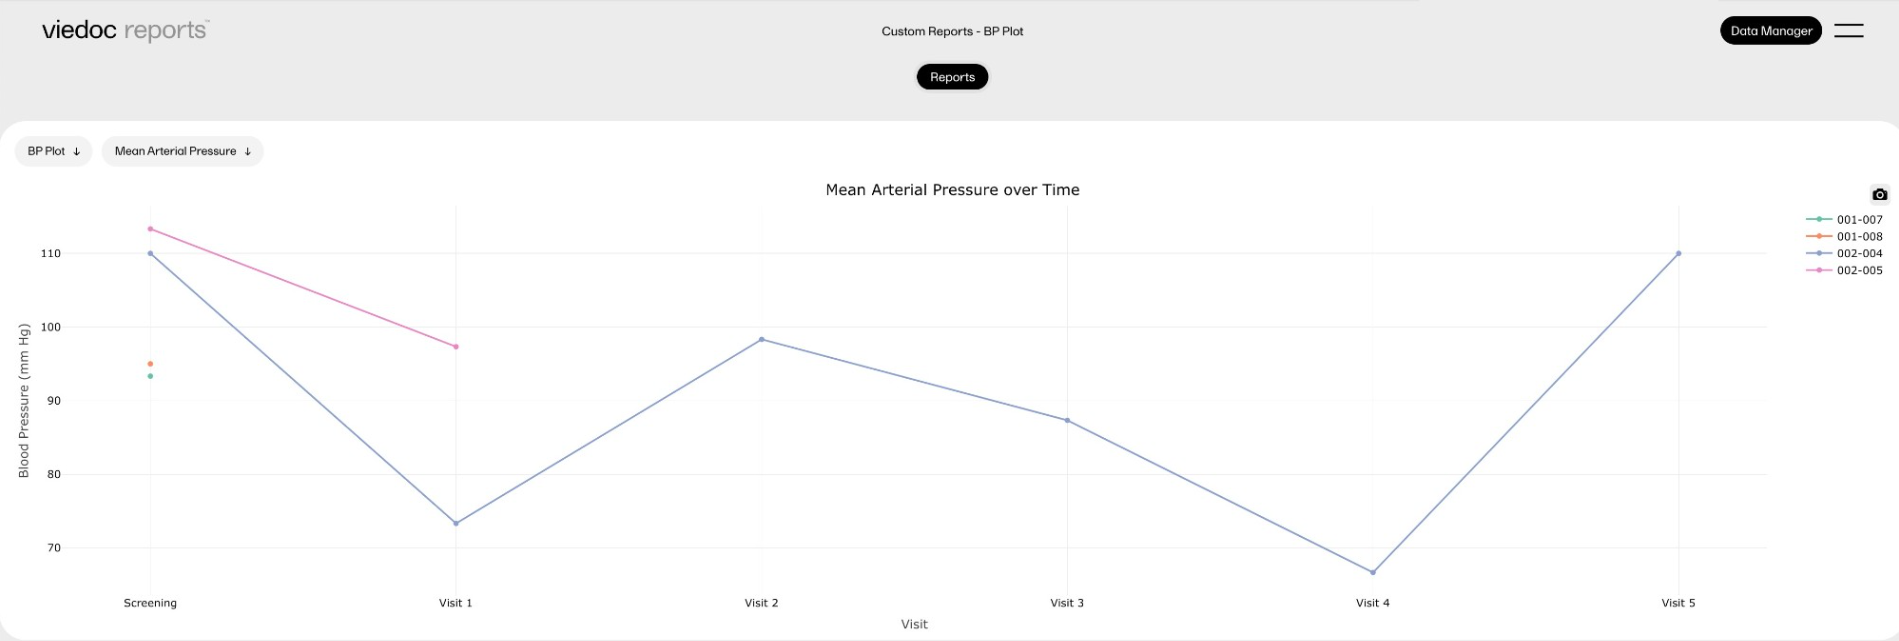
This report displays a survival analysis using the Survival package, as well as a more complicated plot using the 'plotly' package.
This custom report generates the following output:
Sub-report 'Survival Curve': A plot of the Kaplan-Meier model, with 95% confidence intervals.
Sub-report 'Survival Table': A table with the plotted values.
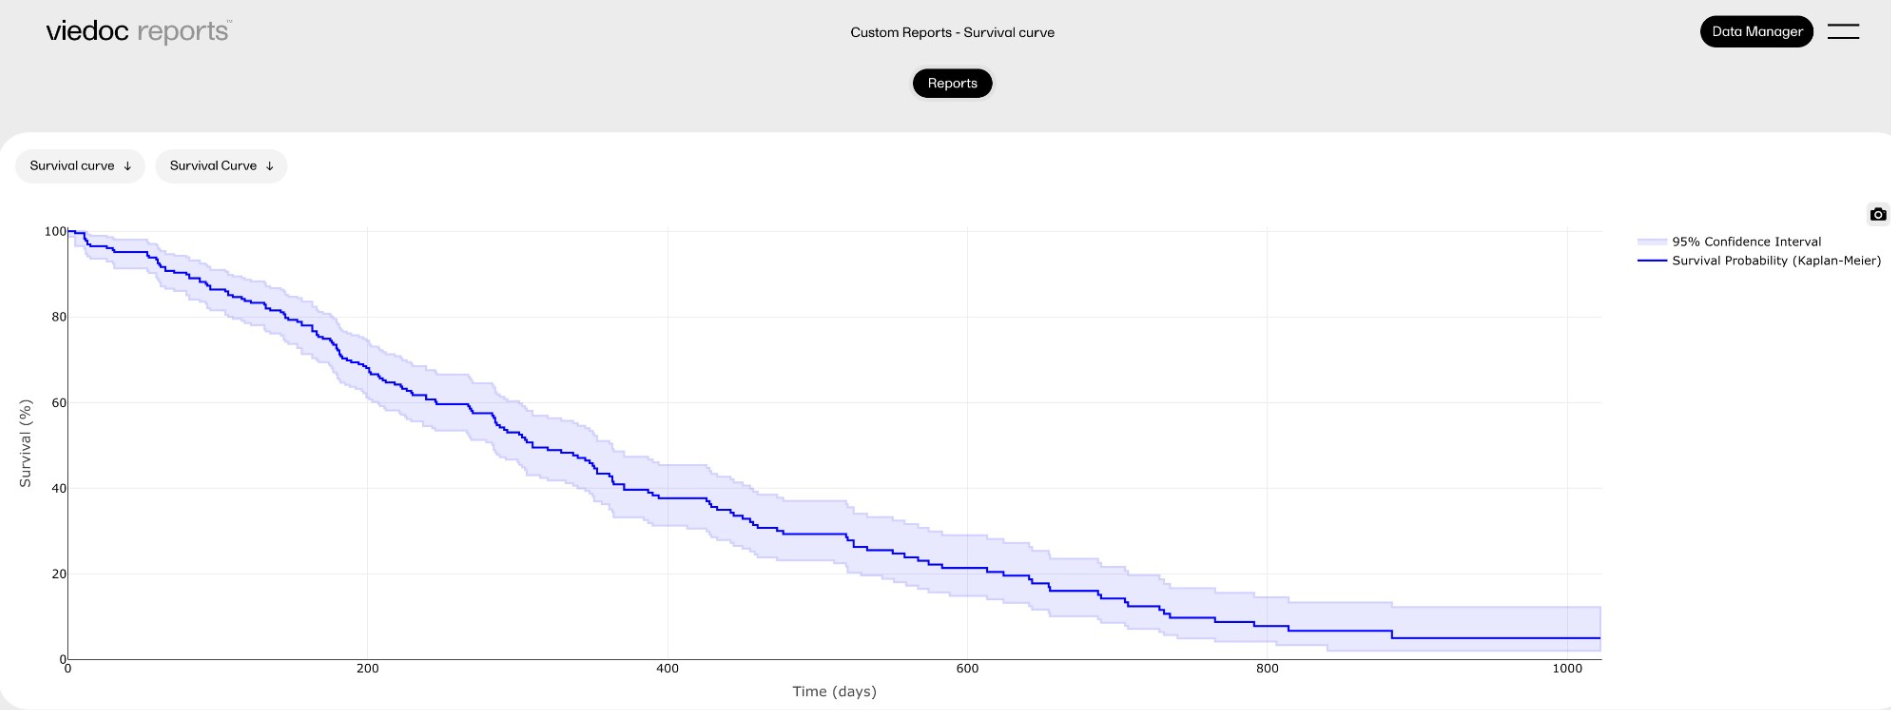
Our Working Smarter webinar series is designed to help Viedoc users get the most out of the platform, from practical tips and feature deep dives to best practices and expert insights. Each session addresses topics for our users including highlighting new features, sharing useful tips, best practices, or deeper insights into specific areas of Viedoc.
Whether you're new to the system or an experienced user, these webinars are here to help you work smarter.
The full list of webinars in Viedoc’s Working Smarter Series, including recordings and Q&A, is provided below.
October 2024
https://help.viedoc.net/l/a29eab/en/
November 2024
https://help.viedoc.net/l/04c262/en/
January 2025
https://help.viedoc.net/l/893419/en/
February 2025
https://help.viedoc.net/l/bb2d9a/en/
March 2025
https://help.viedoc.net/l/027d45/en/
April 2025
https://help.viedoc.net/l/f94362/en/
June 2025
https://help.viedoc.net/l/227838/en/
September 2025
https://help.viedoc.net/l/b01136/en/
November 2025
https://help.viedoc.net/l/f914f3/en/
February 2026
https://help.viedoc.net/l/6c61f9/en/