Reports
Introduction
In Viedoc Reports, you can view Standard and Custom reports in the Reports page. Here you can view the reports and sub reports, search, sort and filter the data, and export the results in various formats. Each report will look different and have different functions, which are described in the sections below.
General functions
Overview of functions the Reports page, which are standard across reports and sub reports:
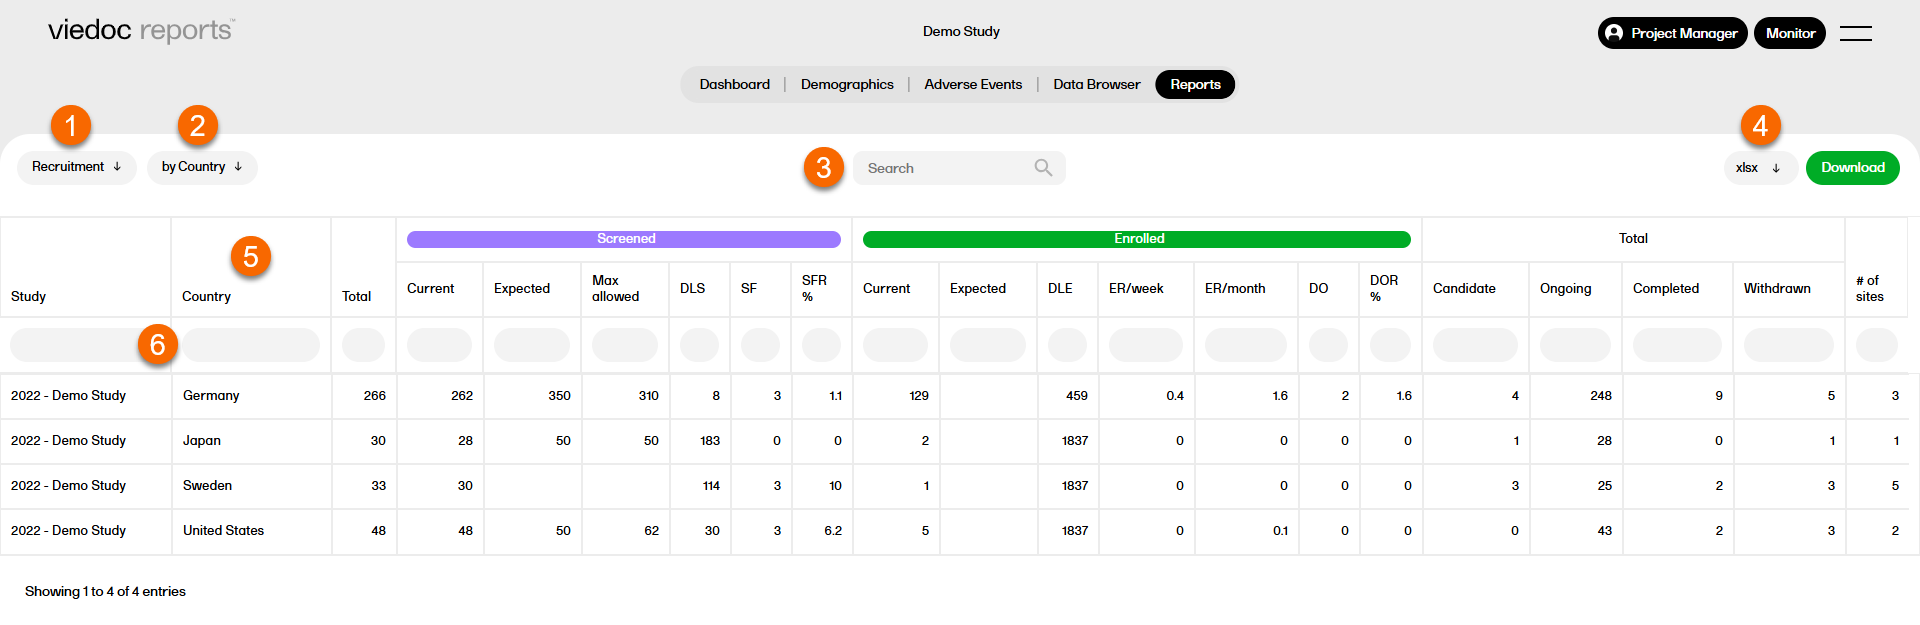
1. Select a report from the dropdown list.
2. Select a sub report.
3. Search within the selected report.
4. Select a format to download the report. For more information, see Downloading reports.
5. Select any column header to sort the data in ascending or descending order.
6. Select the space under any column to filter the data by a specific range. Select the x icon to reset the filter.
General rules and definitions
The following section describes general rules and definitions applicable to all reports.
- Deleted subjects are not counted or included in the reports.
- General hidden forms are counted and displayed in the report
- Forms that are hidden for certain roles are not counted or displayed in reports they generate
- Forms are considered triggered when they are initiated or pending.
- Forms are considered pending when they are uninitiated in initiated events.
Note! This applies to all event types. - Forms are considered initiated when they have at least one item in the form populated.
- Subject Sequence Number is included in all standard reports and sub-reports
alongside Subject ID, allowing subjects to be uniquely identified across reports.
Export version
Reports always use the latest export version. If a new export version is released, users should check the Release Notes to determine if or how their reports or custom reports are affected.
Comment: this text about the data export version exists in overview of Viedoc reports, reports, and creating custom reports lessons.
Standard reports
The reports based on standard data are described in the following sections.
Tip! Many of the standard reports can now be downloaded and customized for use as custom reports. To access the report scripts, please go to the example-standard-reports repository on Viedoc's GitHub.
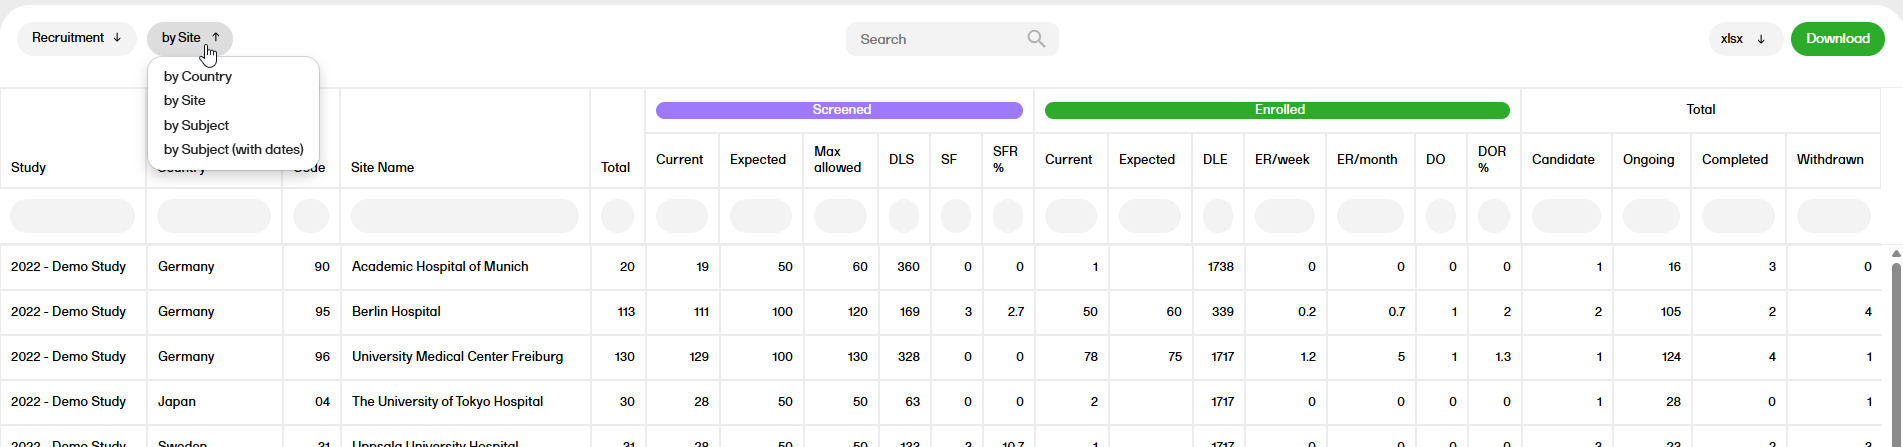
Recruitment
The Recruitment report shows recruitment data with details on the subject status.
For more information on the Recruitment report, please go to: Recruitment
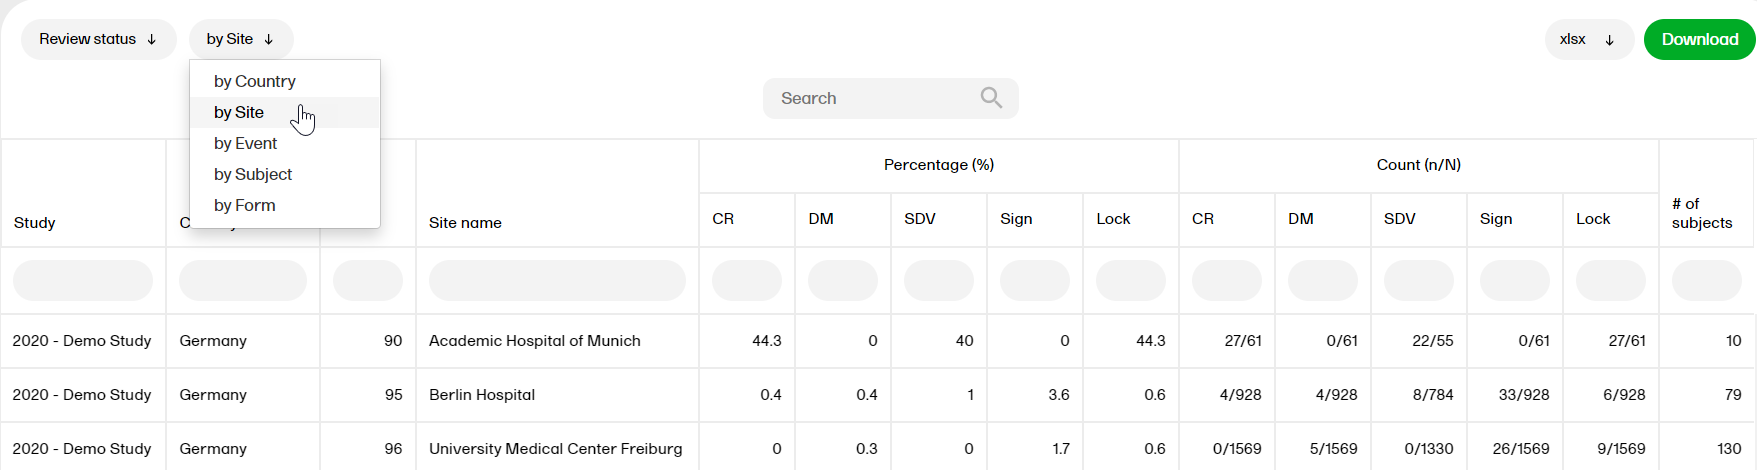
Review status
The Review status report shows the review status (Clinical, Data, Source Data Verification (SDV), Sign, and Lock).
For more information on the Review status report, please go to: Review status
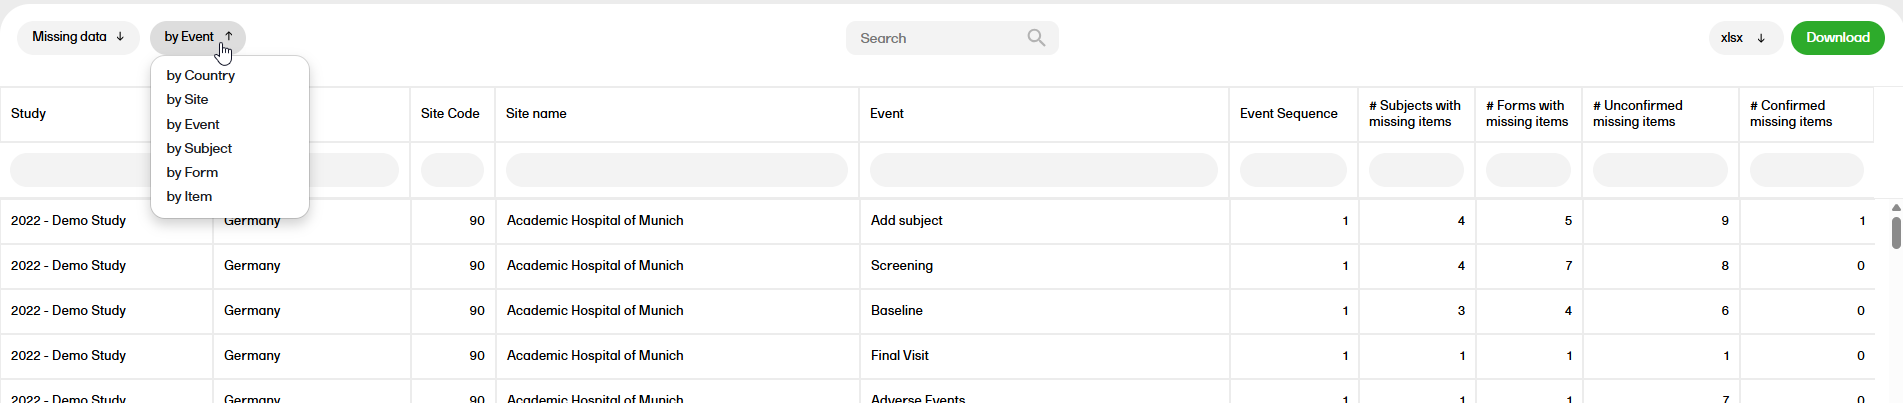
Missing data
The Missing data report shows the missing items.
For more information on the Missing data report, please go to: Missing data
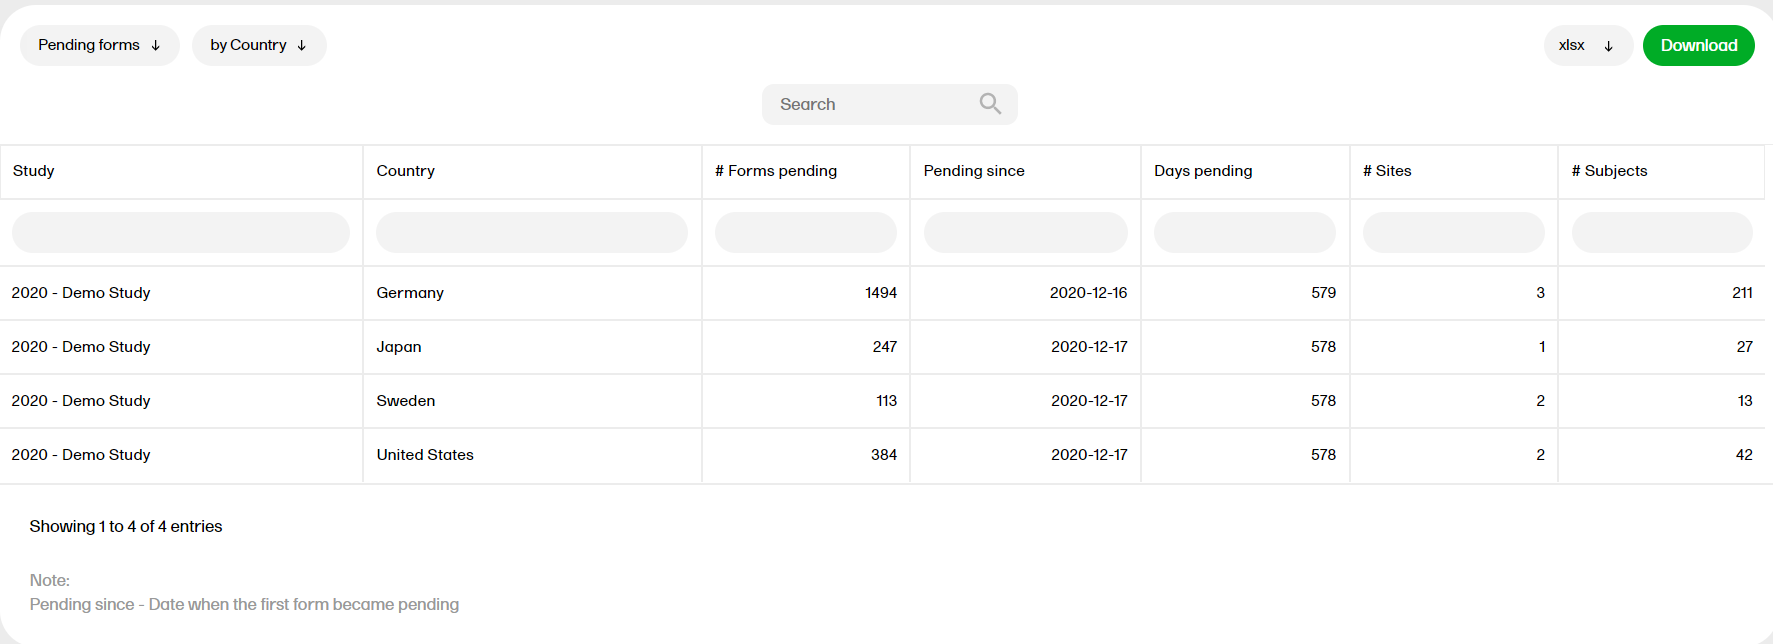
Pending forms
The Pending forms report shows the pending forms. Forms are considered pending when they are uninitiated in initiated events. This applies to all types of events, including subject-initiated events. For repeating forms, if the first instance of the form is uninitiated, the form is considered pending. Resetting a form results in that form being pending.
For more information on the Pending forms report, please go to: Pending forms
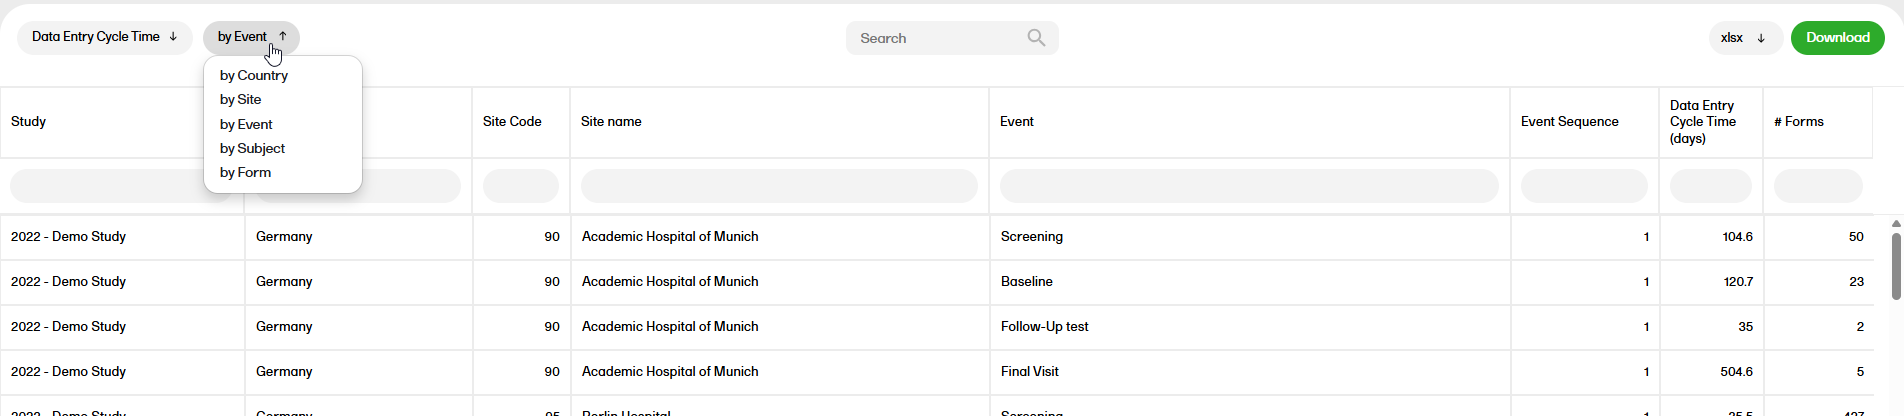
Data entry cycle time
The Data entry cycle time report shows how long time it takes for the sites to enter form data.
For more information on the Data entry cycle time report, please go to: Data entry cycle time
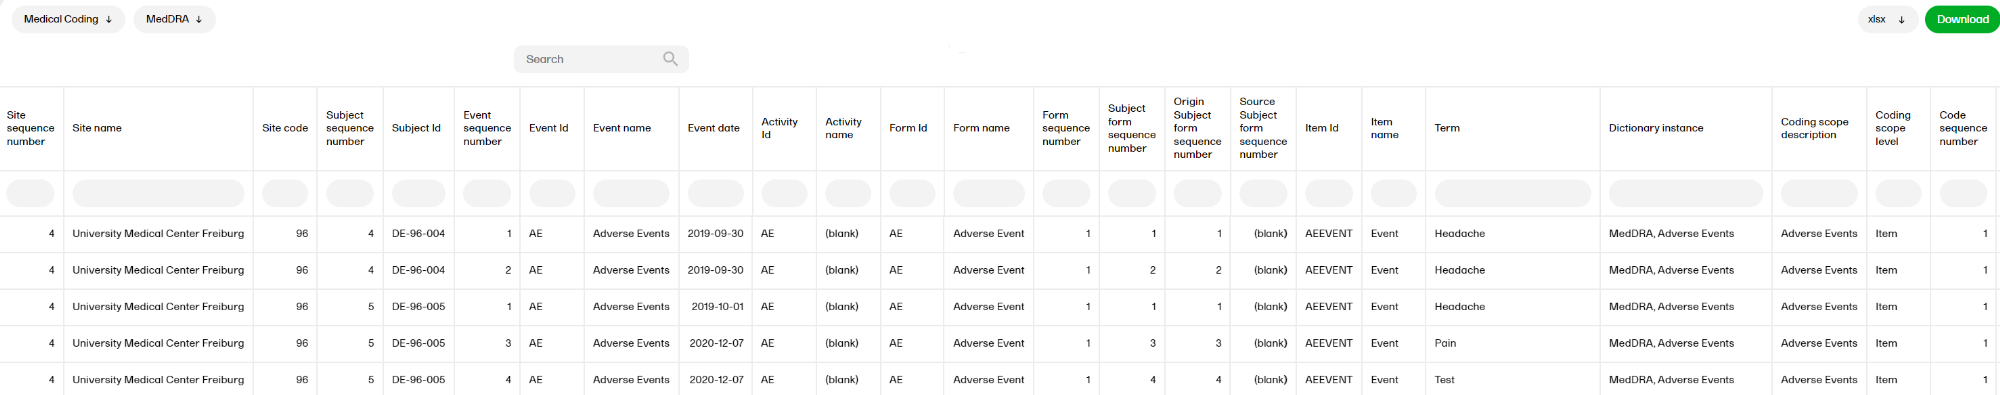
Medical coding
The Medical coding report shows the coded data in the study. You can select reports for the dictionaries WHODrug, MedDRA, MedDRA_J, ATC without DDD, and IDF.
For more information on the Medical coding report, please go to: Medical coding
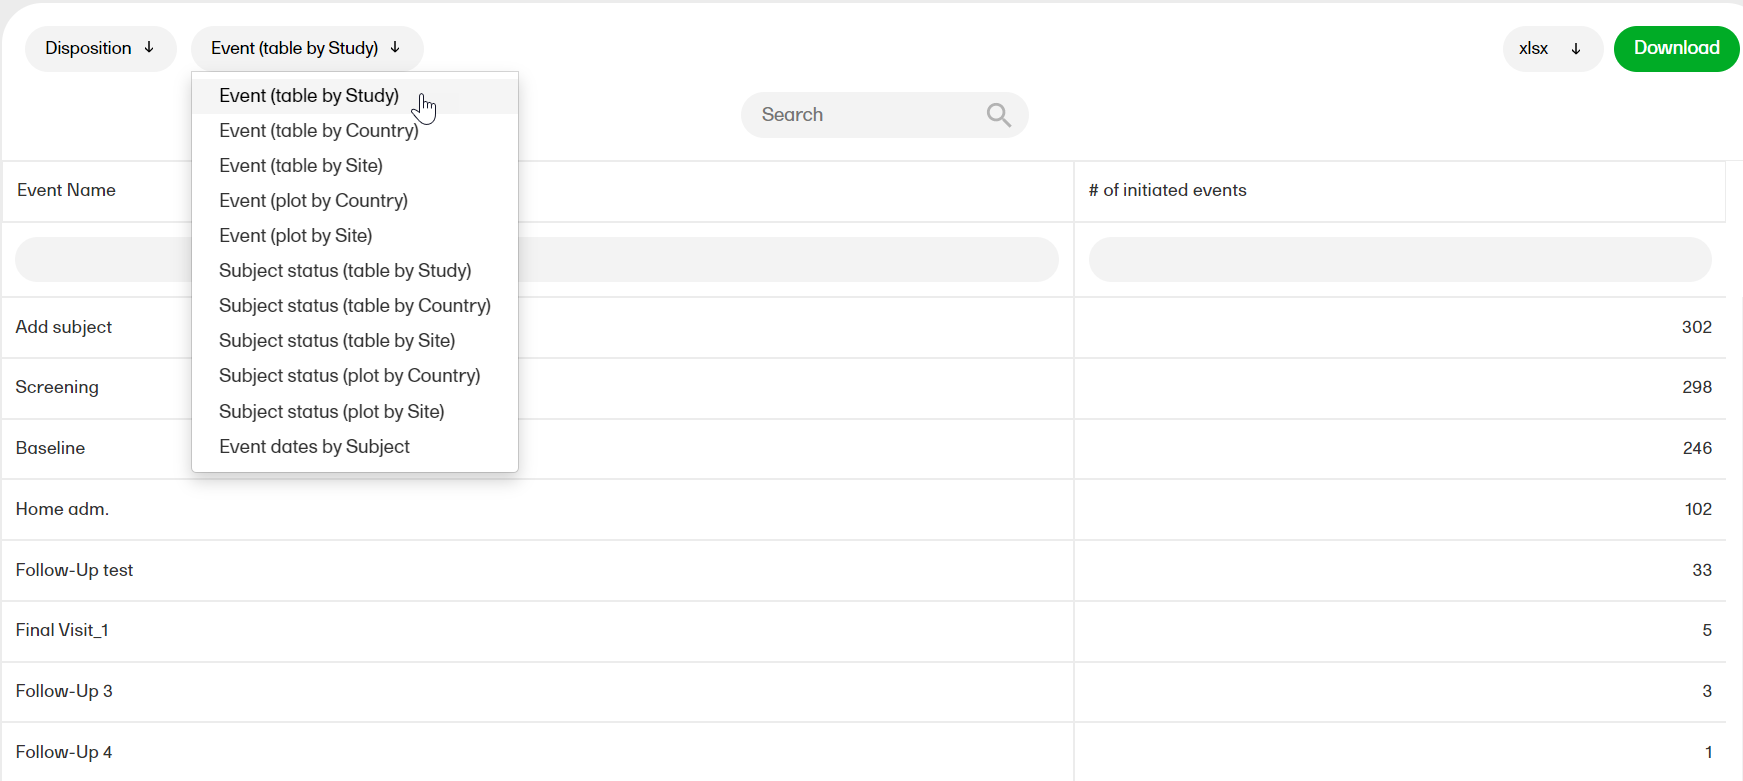
Disposition
The Disposition report shows overviews of the current disposition status of the subjects across the study.
For more information on the Disposition report, please go to: Disposition
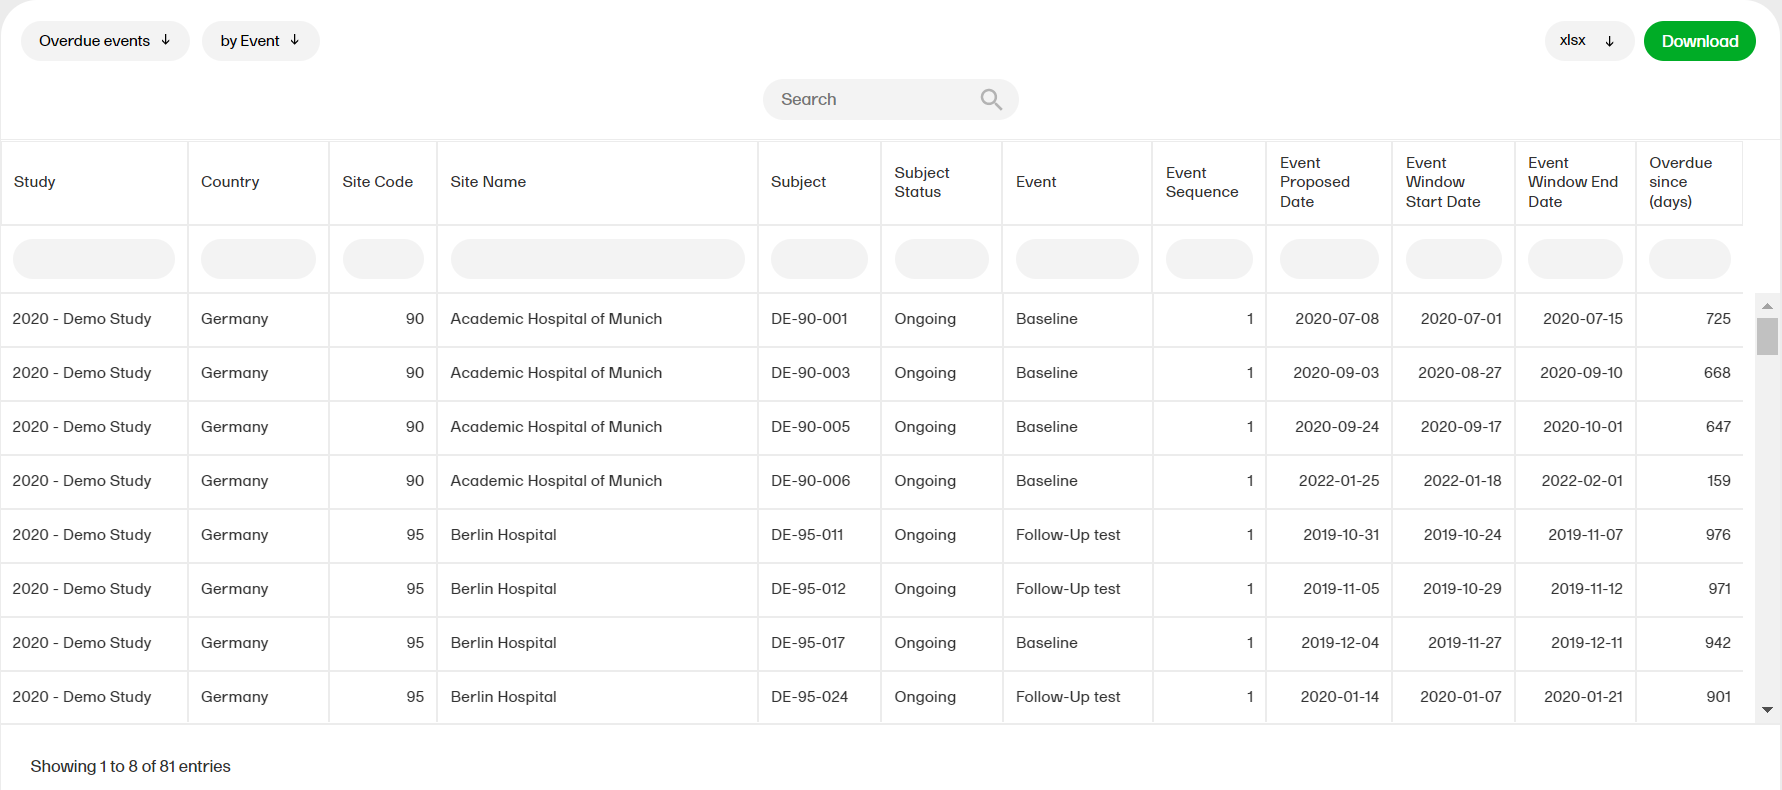
Overdue events
The Overdue events reports for the sub reports ‘by Country', ‘by Site', ‘by Subject', ‘by Event’ shows the events that have the Proposed date and Event Window End Date set to a past date.
For more information about the Overdue events report, please select this link: Overdue events
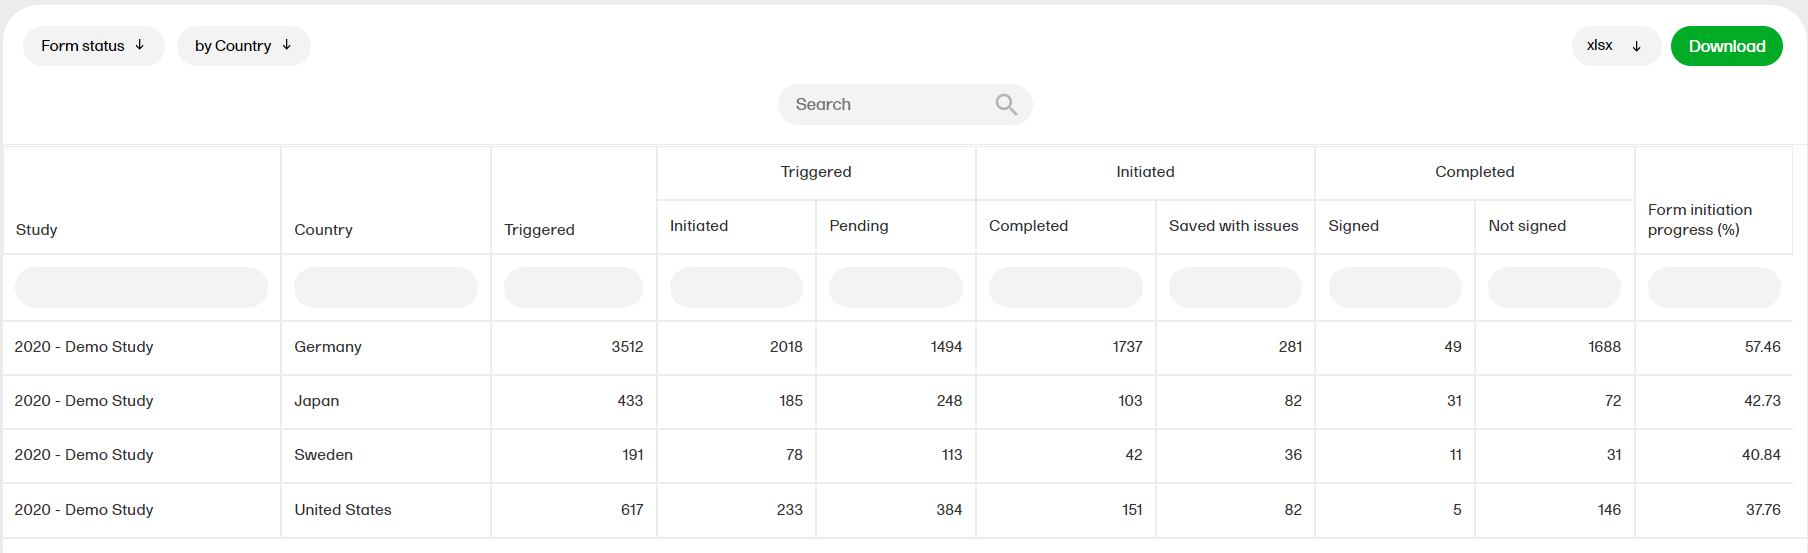
Form status
The form status report gives an overview of the status of forms, for example, initiated, pending, completed, saved with issues, unsigned etc.
For more information on the Form status report, please select this link: Form status
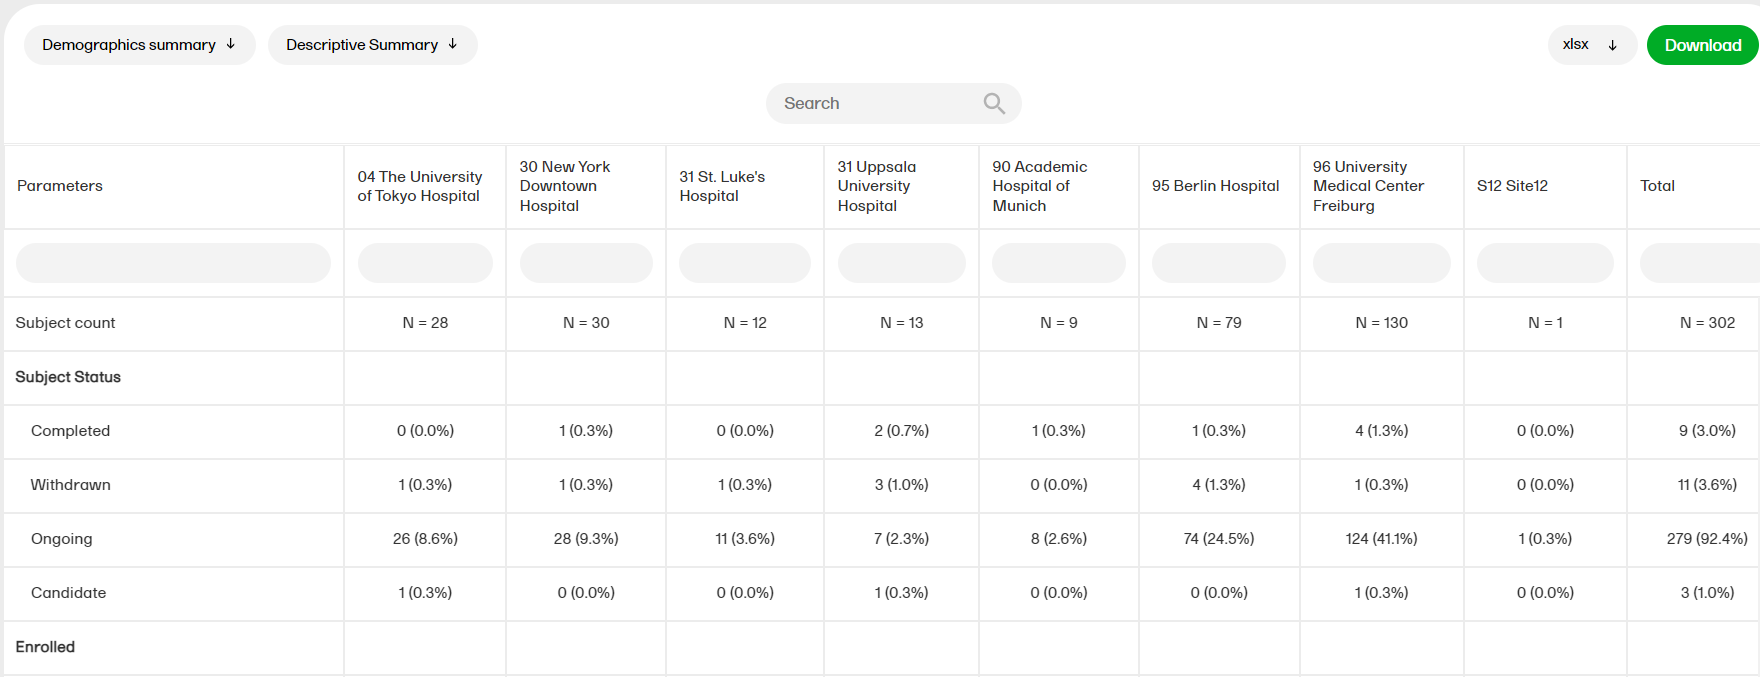
Demographics summary
The Demographics summary report shows a table and a pie chart with the variables from the Demographics page.
For more information on the Demographics summary report, please go to: Demographics summary
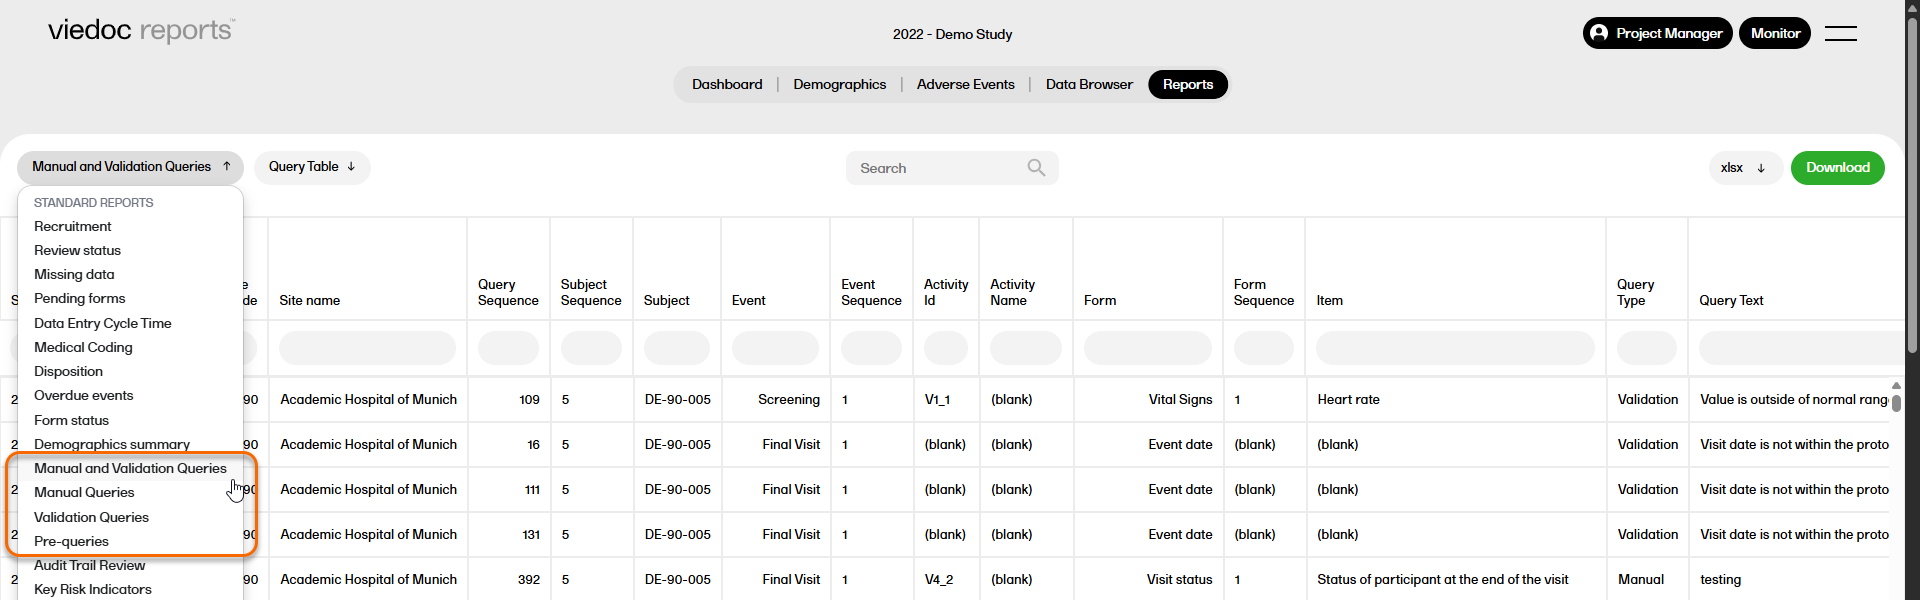
Query reports
There are four query reports available (manual and validation queries, manual queries, validation queries, pre-queries) that show the detailed query data at different levels across the studies.
For more information on Query reports, please go to: Query reports
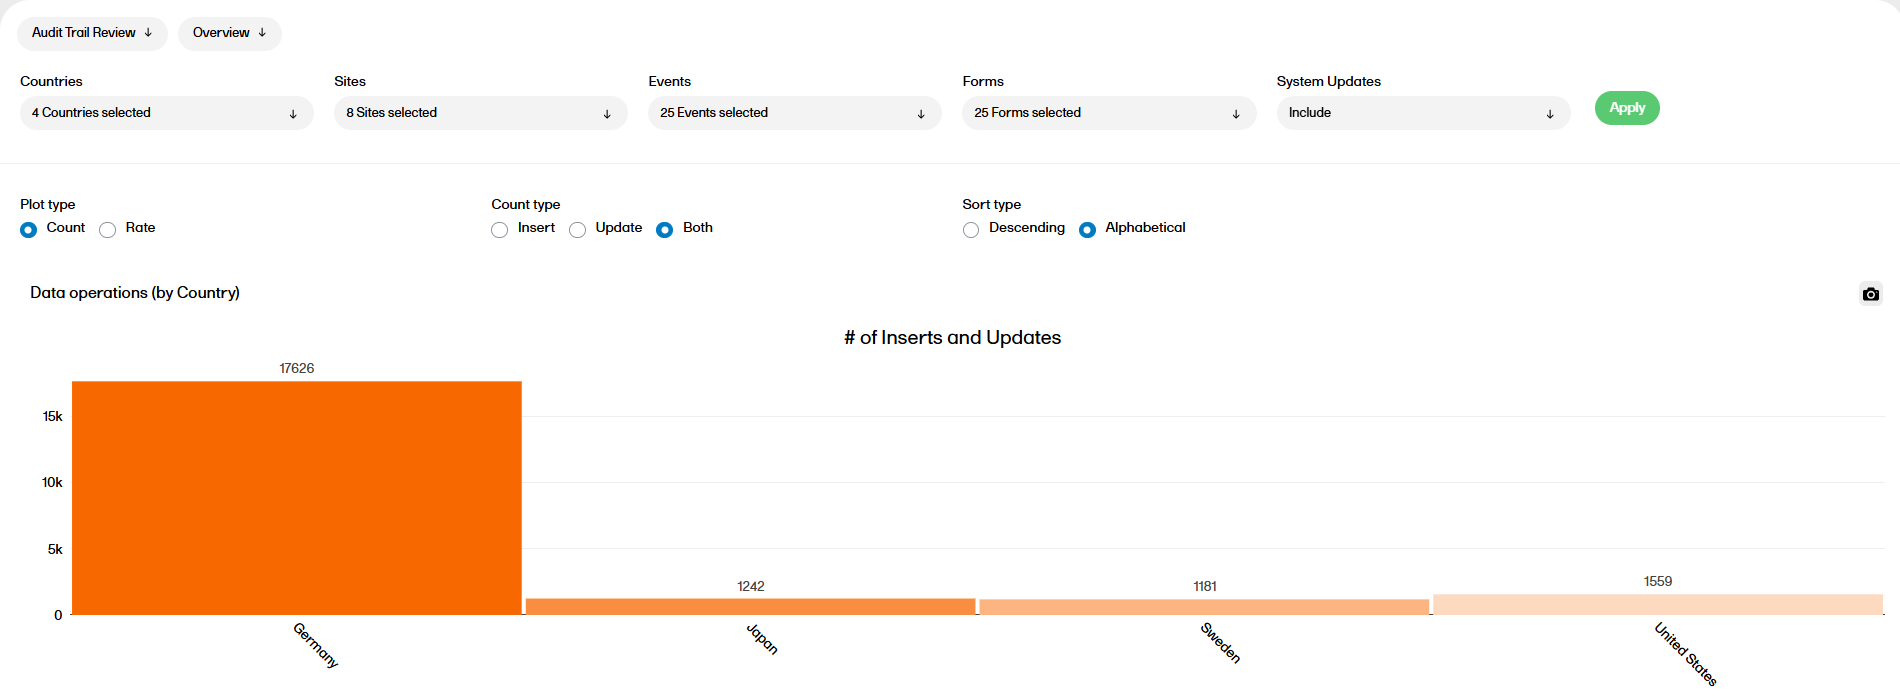
Audit trail review
The Audit trail review report shows divergences to the normal data entry pattern as well as the general performance. This report has two sub reports, Overview and Change over time.
For more information on the Audit Trail Review report, please go to: Audit trail Review
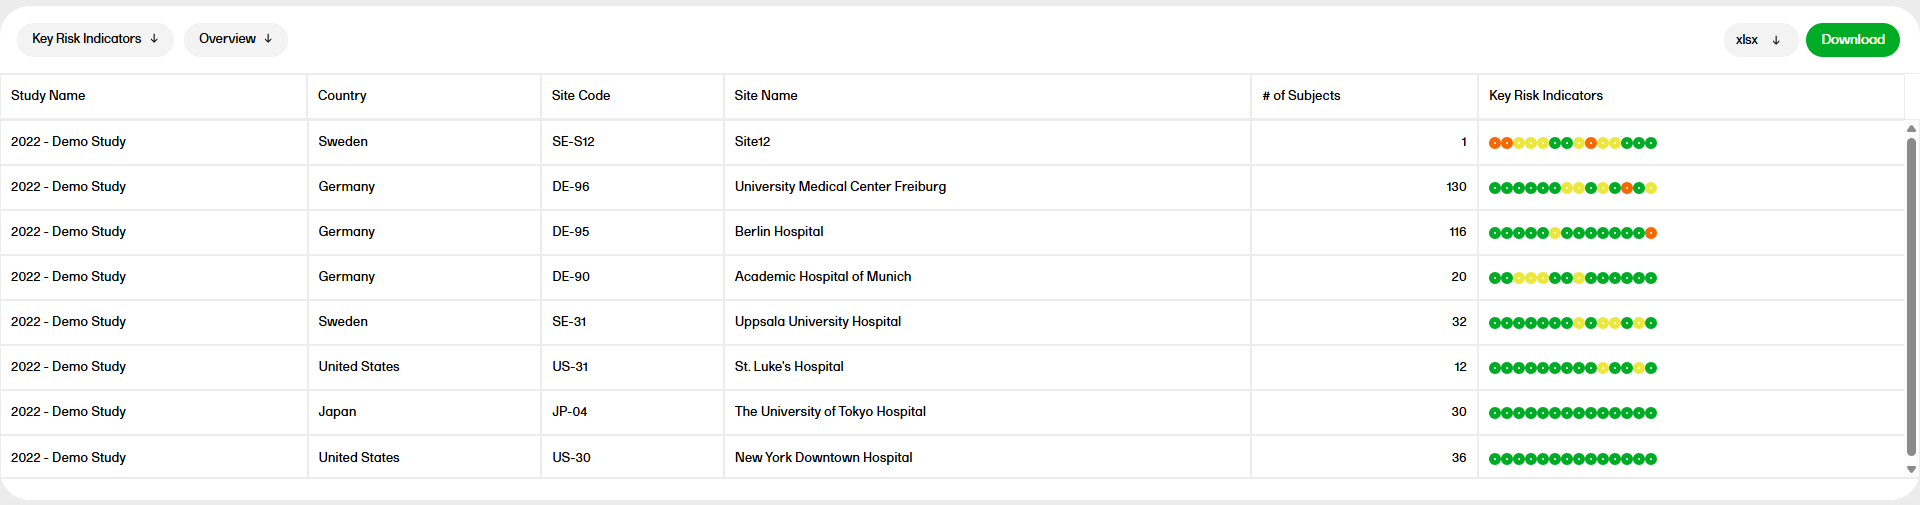
Key risk indicators
The Key risk indicators (KRI) report gives you a quick overview of the key risk indicators per site. This report has three sub reports: Overview, by Site, and by Key risk indicator.
For more information on the Key risk indicators report, please go to: Key risk indicators report.
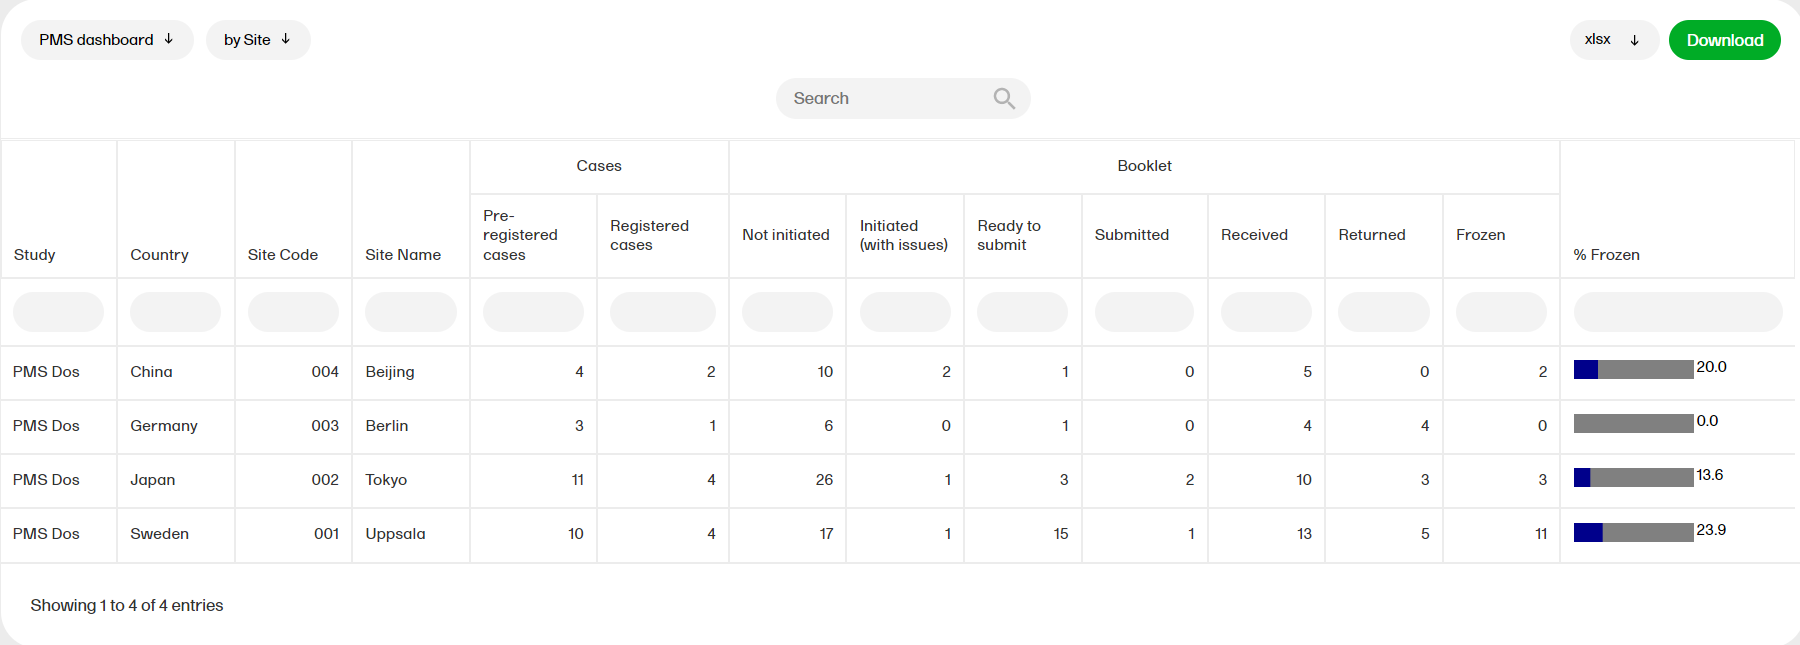
PMS dashboard
The PMS dashboard report is available for Japanese PMS studies only and shows the following booklet statuses. You can sort the data to focus on the booklet status by site, subject, booklet, booklet history, or timelapse with the following columns showing, respectively:
by Site
- Study, Country, Site Code, Site Name
- The Cases columns show: # Pre-registered and # Registered subjects from the subject status.
- The Booklet columns show: Not Initiated, Initiated (with issues) - initiated records that have open queries, Ready to submit - Initiated records that have no open queries, Submitted, Received, Returned, Frozen.
This shows a site level summary of booklets status along with the number of pre-registered and registered cases. Booklet freeze progress as a percentage is shown as a bar plot.
by Subject
- Study, Country, Site Code, Site Name, Subject, Subject added date (from subjectAddedDate.rds), Subject completed date (from Subject Status)
- The Booklet columns show: Not Initiated, Initiated (with issues) - initiated records that have open queries, Ready to submit - Initiated records that have no open queries, Submitted, Received, Returned, Frozen.
This shows a subject-level summary of booklet status along with the Subject added date and Subject completed date. Booklet freeze progress as a percentage is shown as a bar plot.
by Booklet
- Study, Country, Site Code, Site Name, Subject
- The Booklet columns show: Booklet name, Booklet sequence #, Current status, Last activity date, Booklet start date, Booklet end date.
- The Queries columns show: # of raised queries, # of resolved queries, # of closed queries, # of rejected queries, # of approved queries, and # of removed queries.
This shows a booklet level summary of current booklet status and last activity date along with the number of open, resolved and closed queries.
by Booklet (history)
- Study, Country, Site sequence number, Site Code, Site Name, Subject sequence #, Subject, Subject added date, Booklet Name, Booklet sequence #, Booklet Status, Booklet Activity, Date & Time (UTC), User Name (ID)
This shows the Booklet status history- the user can filter for a specific date along with the Subject added date from the subjectAddedDate.rds file.
Note! This does not include "Not Initiated" records.
Timelapse
- Study, Country, Site Code, Site Name, Subject, Booklet Submitted Lapse Days
- The Queries columns show: Time to Resolution, Time to Approval
Time to Resolution shows the timelapse between the time raised to the time resolved or closed for each booklet status, summarized at Subject level.
Time to Approval shows the timelapse between the time resolved to the time approved OR rejected for each booklet status, summarized at Subject level.
Note! This is for subjects that have at least one booklet that has been Initiated and submitted. Also, the lapse in Resolved and Closed queries for a subject is obtained from Queries and displayed.
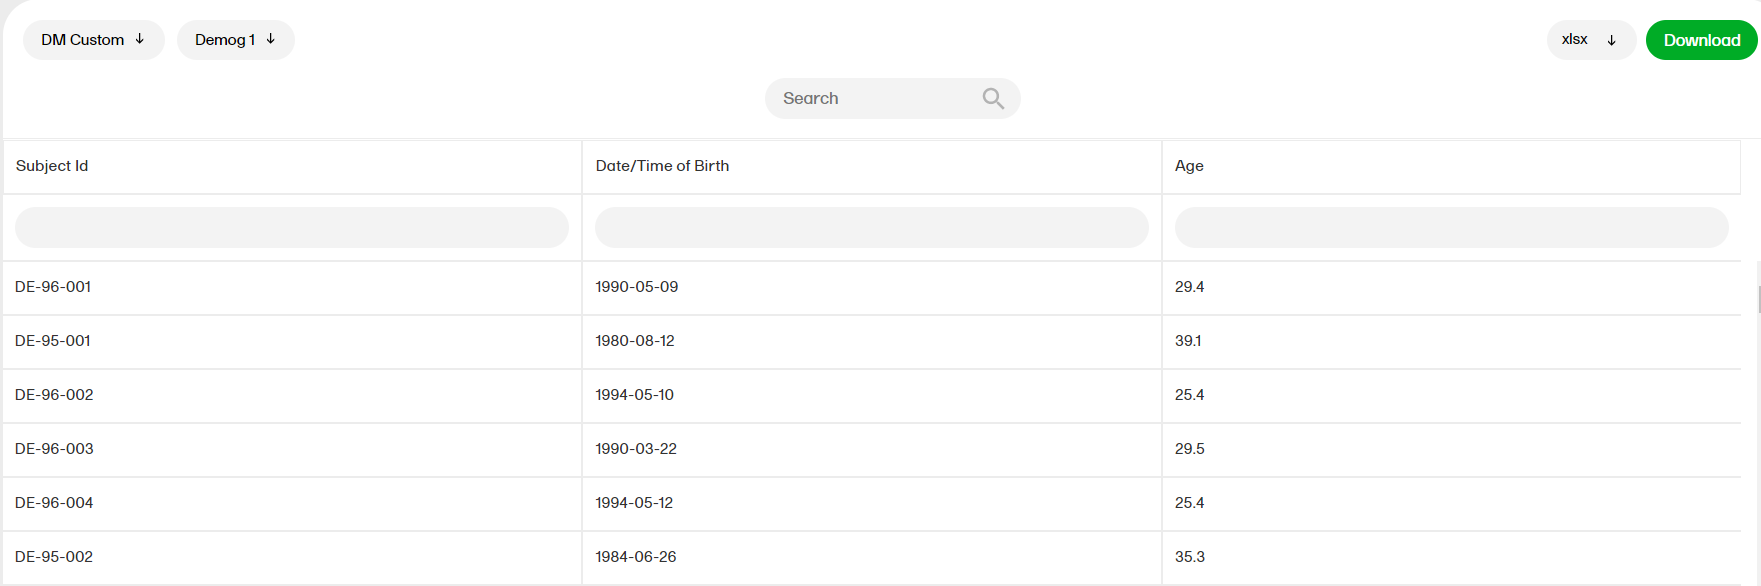
Custom reports
The reports under Custom reports are tailor-made and study-specific. Custom reports can be downloaded at all times, regardless of the user permission set for the role in Viedoc Designer.
Tip! Several report templates can now be downloaded as R scripts and customized for use as custom reports. To access the report scripts, please go to the custom-reports repository on Viedoc's GitHub.
The sort filters and columns showing the data depend on the report. Here you can see an example where the custom report DM Custom contains two filters, Demog1 and Demog2 (not visible in the image):
Note! Some columns of the report may be empty, this is due to the visibility settings for your user role on CRF level.
For more information, go to the Creating custom reports lesson.
Downloading reports
You can download the reports in the following formats:
- XLSX
- CSV
- XPT
- XPTV8
- RDS
- XML - for custom reports, and only if the following criteria are met:
- The report output is specified as XML in the R script:
reportOutput <- list("xml" = new_xml_1) - The output file contains
Identifier:validationCheck <- "Identifier" - The report name contains the text string
E2B
For more information, see Custom reports. - The report output is specified as XML in the R script:
Note!
- Any sorting done in the report will not be reflected in the downloaded file.
- Downloading a file is available regardless of the user permission set for the role in Viedoc Designer.
The structure of the file name is as follows:
[STUDYNAME_REPORTNAME_DATE/TIMESTAMP.FORMAT]
If sub reports are available, then the file name is:
[STUDYNAME_REPORTNAME_SUBREPORT_DATE/TIMESTAMP.FORMAT]
[DATE/TIMESTAMP] is in the following structure:
[YYYYMMDDHHMMSS], which is the date and time at which the data was downloaded from Viedoc (through the daily data sync).
Example of a file name: "DemoStudy2020_Review status_20200903220345.csv"
Download actions
There are two ways of downloading reports on the Reports page. You can either download a selected Standard report or download all the Standard reports.
To download data from a selected Standard report:
| 1. |
Select the specific report you want to download from the STANDARD REPORTS dropdown menu. In the example below, the Recruitment report is selected. 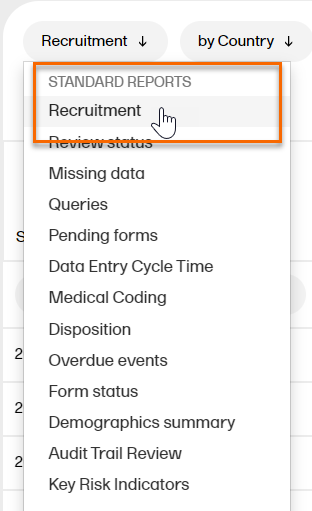
|
| 2. |
In Settings, select Download selected subreport in the dropdown menu. 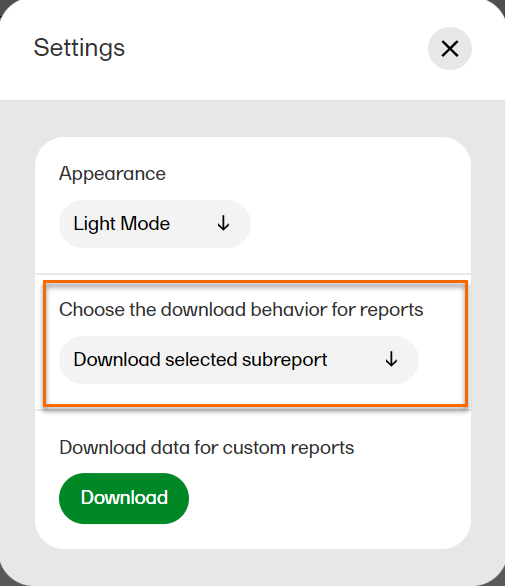
|
| 3. |
1. Select a format to download. 2. Select Download. 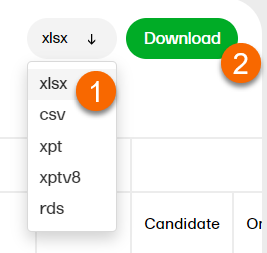
|
To download data from all Standard reports simultaneously:
| 1. |
In Settings, select Download all subreports in the dropdown menu. 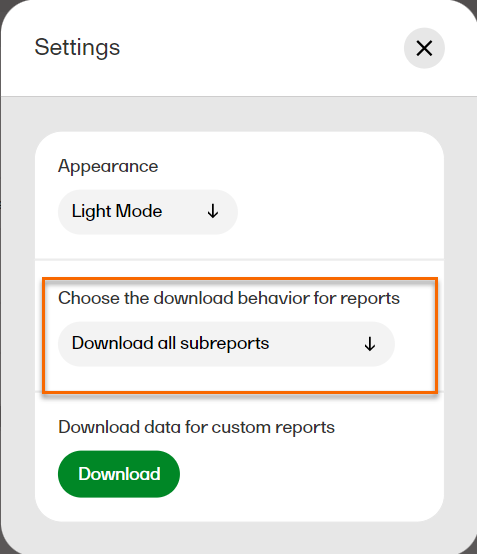
|
|
2. |
1. Select a format to download. 2. Select Download.
Note! When the formats xlsx/csv/xpt/xptv8 are selected, a zip file is created. The structure of the file name is as follows: [STUDYNAME_REPORTNAME_DATE/TIMESTAMP.zip].
Example of a file name: Demo Study_Recruitment_202203230002854.xlsx
Example of a file name: Demo Study_Recruitment_by Country_20220329230643.rds
|
Note!
- The Key risk indicator report has the download behavior Download selected subreport by default due to user selections available in sub reports.
- The Audit trail review report does not have a download feature.
Data sync
There is a possibility that Viedoc Reports will fall out of sync. If Viedoc Reports falls out of sync, we suggest that you take the following steps to reset and reinitiate the sync job.
| 1. | Disable Viedoc Reports in Viedoc Admin/Study settings. |
| 2. | Wait 1 hour. |
| 3. | Enable Viedoc Reports in Viedoc Admin/Study settings. |
The sync will be reset and reinitiated. Your Viedoc Reports should display the correct data. If you continue to encounter an issue please contact your Viedoc representative.