Configuring Viedoc Reports
Introduction
In Reports configuration, you set up what data the Viedoc Reports application will collect and display. You also set up the report pages that the users can access. The five main settings are as follows:
- Visibility settings - here you configure the visibility settings for the roles that have Reports permission
- Dashboard - here you define the reason for when a subject is considered withdrawn
- Demographics - here you configure what items to be populated in the Demographics section in Viedoc Reports
- Adverse events - here you configure what items to be populated in the Adverse Event section in Viedoc Reports
- Custom reports - here you upload your own custom reports to be shown in the Reports section in Viedoc Reports
For more information about Viedoc Reports, see Viedoc Reports User Guide.
Configuring Reports
To configure Reports:
| 1 | In Viedoc Designer, select the study for which you would like to configure Reports. |
| 2 |
In the Global design settings field, click Edit. 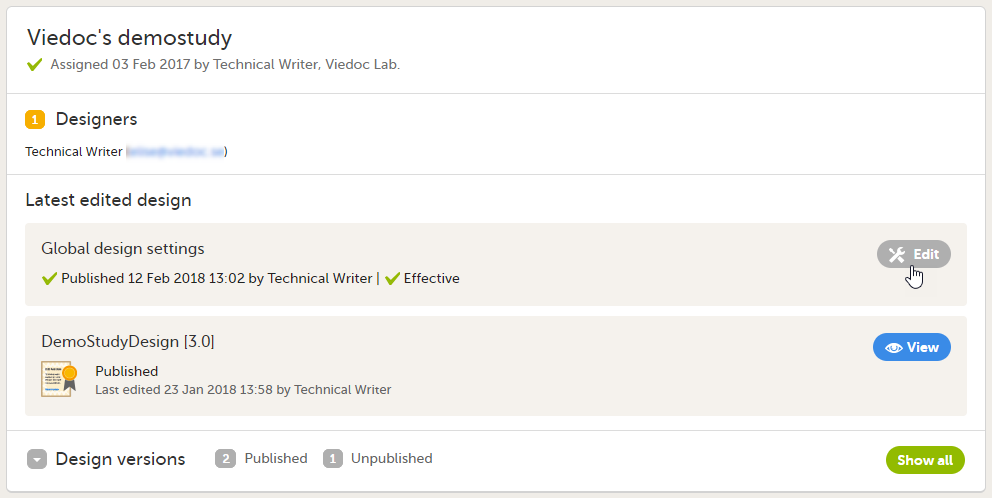
|
| 3 |
In the Reports configuration field, click Edit. 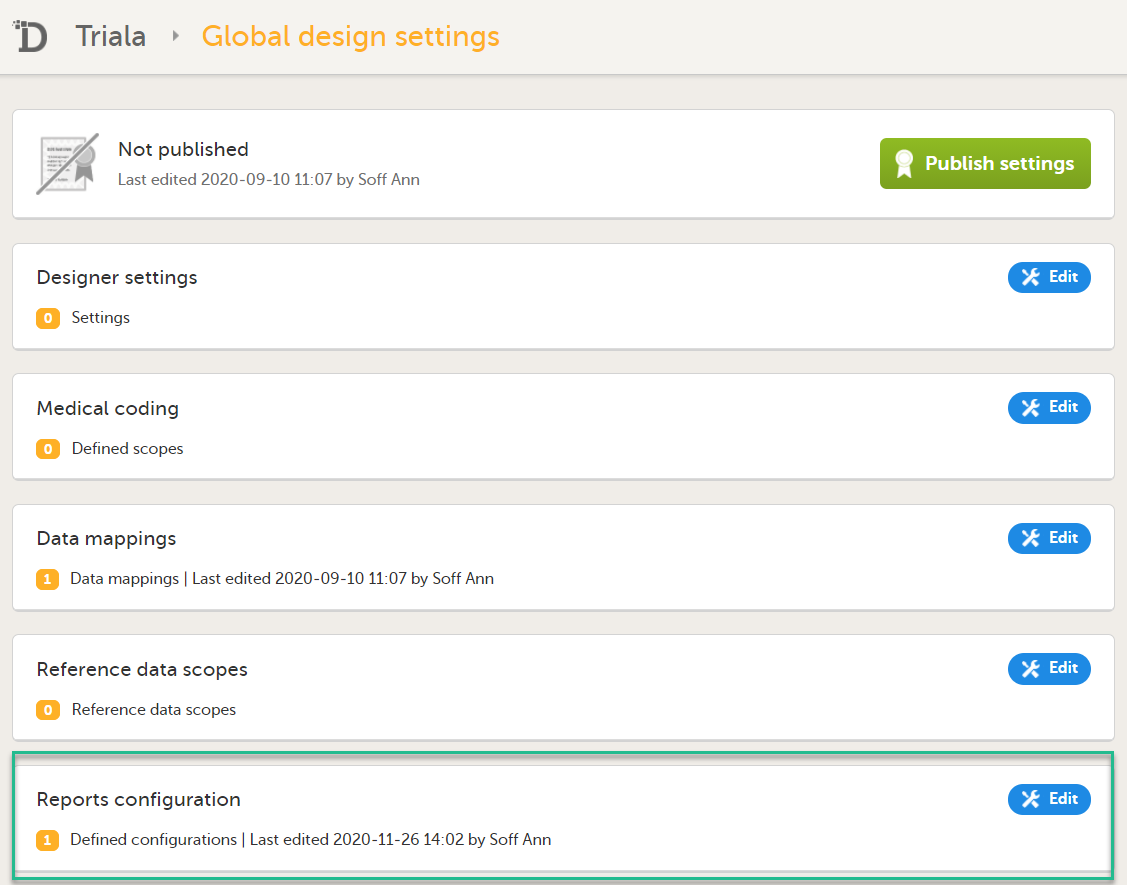
|
| 4 |
You can now configure the settings by clicking Edit in one of the fields: Visibility settings, Dashboard, Demographics, Adverse events, Custom reports. 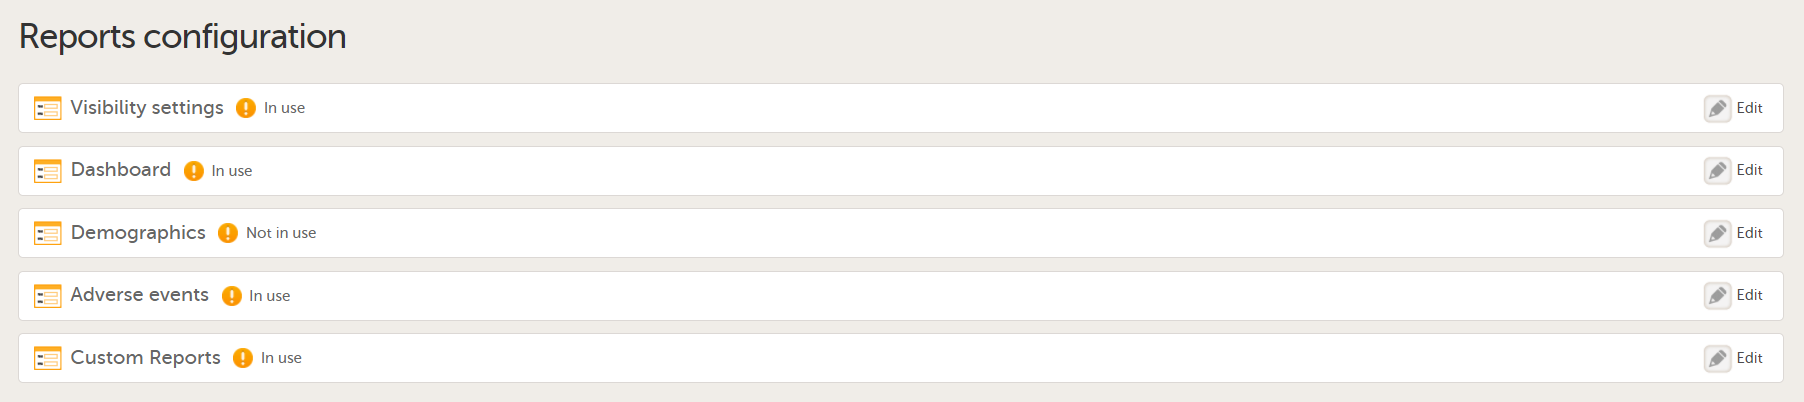
After editing and saving any changes, the Not in use status changes to In use. |
| 5 |
Publish your global design settings. |
| 6 | Publish your design. |
Visibility settings
In Visibility settings, you can configure the roles that should have access to the different report pages:
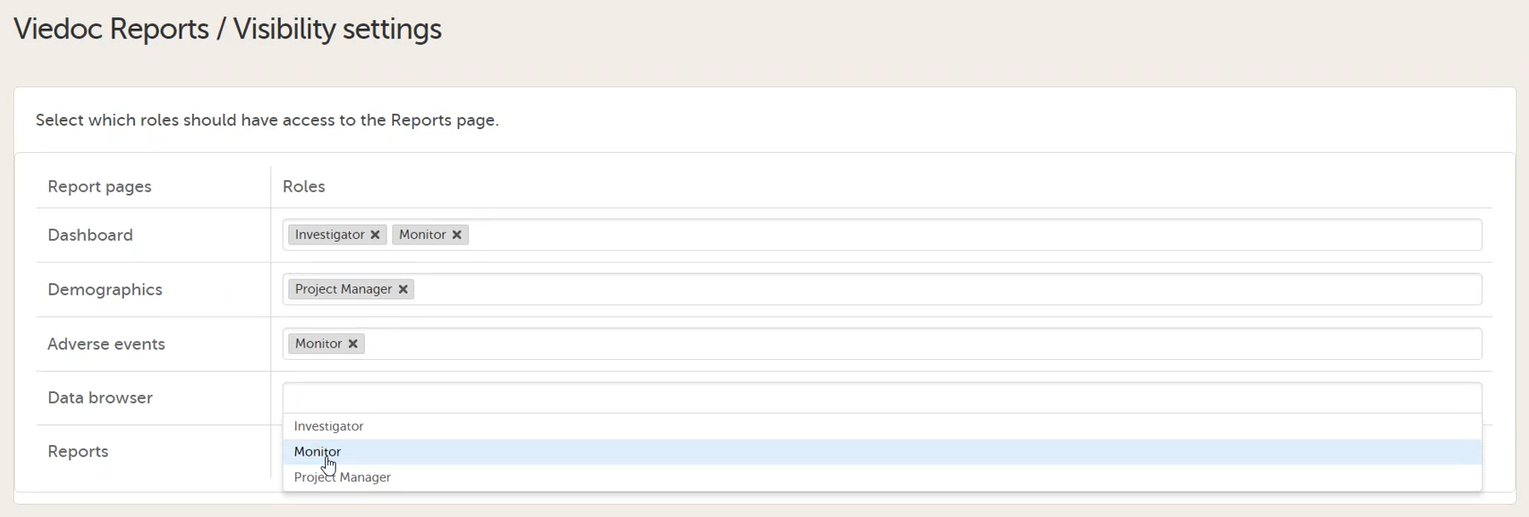
By clicking on a field, a dropdown list is displayed with the roles that are selectable for each page. When all pages are mapped with the desired roles, click Save changes and close the window.
Note!
- A role only shows up here if the permission for Reports is selected on the Roles page. Additionally, to be able to export reports on the Data browser and Reports pages, the user must have export rights. The export is allowed only if the export permission is applicable to all the assigned sites. See Configuring roles for more information.
- The data sync in Viedoc Reports can delay the application of the role settings up to 24 hours.
- Users can download reports whether they have export rights or not, except for the raw data. They need export rights to download the raw data.
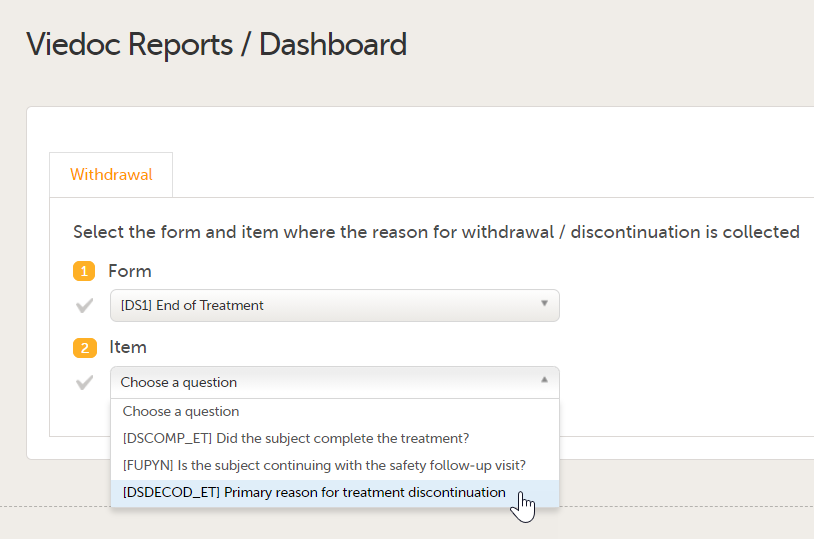
Dashboard
In Dashboard, you can select a form and an item from which the reason for withdrawal or discontinuation is collected. This is then presented in Reports in a graph. For this to work, you must have a form with a codelist item where you have several options. After making your settings, click Save changes and close the window.
Demographics
In Demographics, you can configure up to five graphs to be presented in the Demographics page, showing the distribution of the Demographics data.
To configure the graphs:
| 1 |
Select a form and the corresponding form item from which you want the data to be collected. 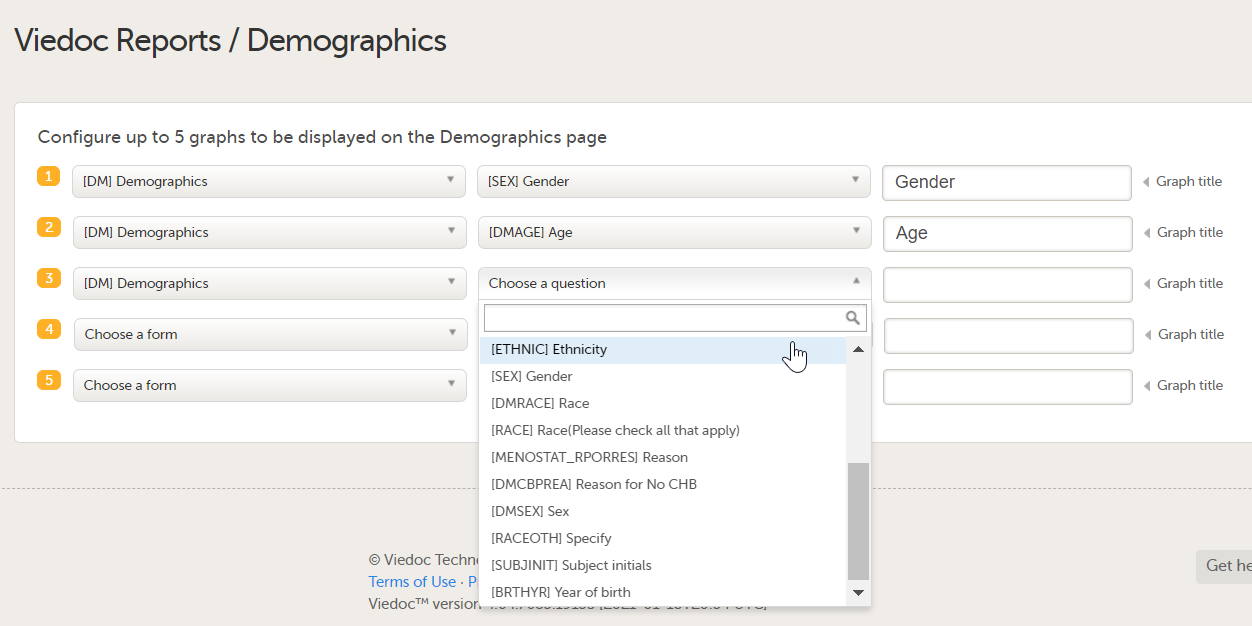
|
| 2 |
Give the graph a title. Note! If you don't name it, the form item name is used as the title. |
| 3 | After making your settings, click Save changes and close the window. |
Note! When selecting the items to populate the plots, if the same item or form is used across more than one event, or, if the form is a repeating form, the system will use the latest non-blank value only.
Adverse events
In Adverse events, you can configure up to five graphs to be presented in the Adverse events page, showing the distribution of Adverse events data.
To configure the graphs:
| 1 |
Select the Adverse event form and the corresponding form items from which you want the data to be collected. 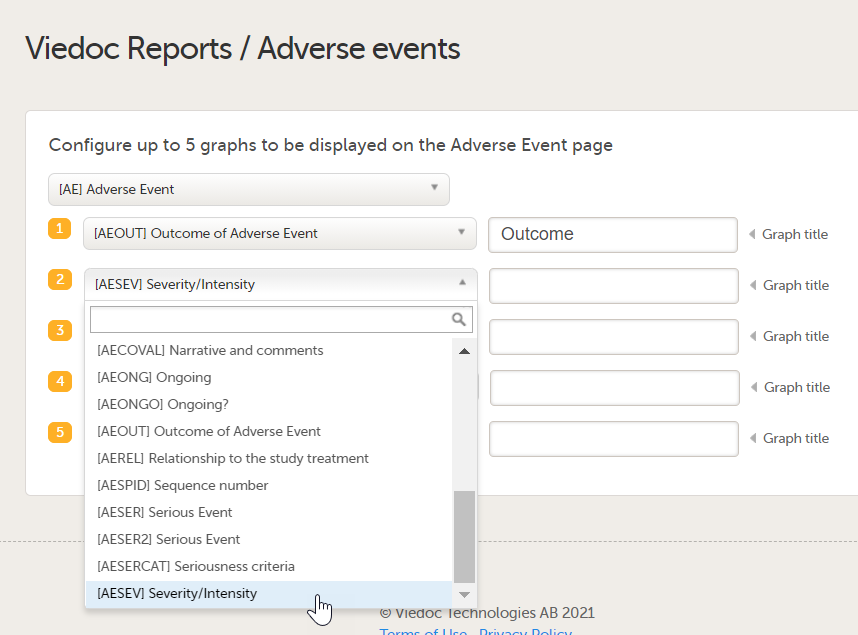
|
| 2 |
Give the graph a title. Note! If you don't name it, the form item name is used as the title. |
| 3 | After making your settings, click Save changes and close the window. |
Custom reports
In Custom reports, you can upload your own, programmed custom reports in R format.
To upload a report:
| 1 |
Click Add a new custom report. 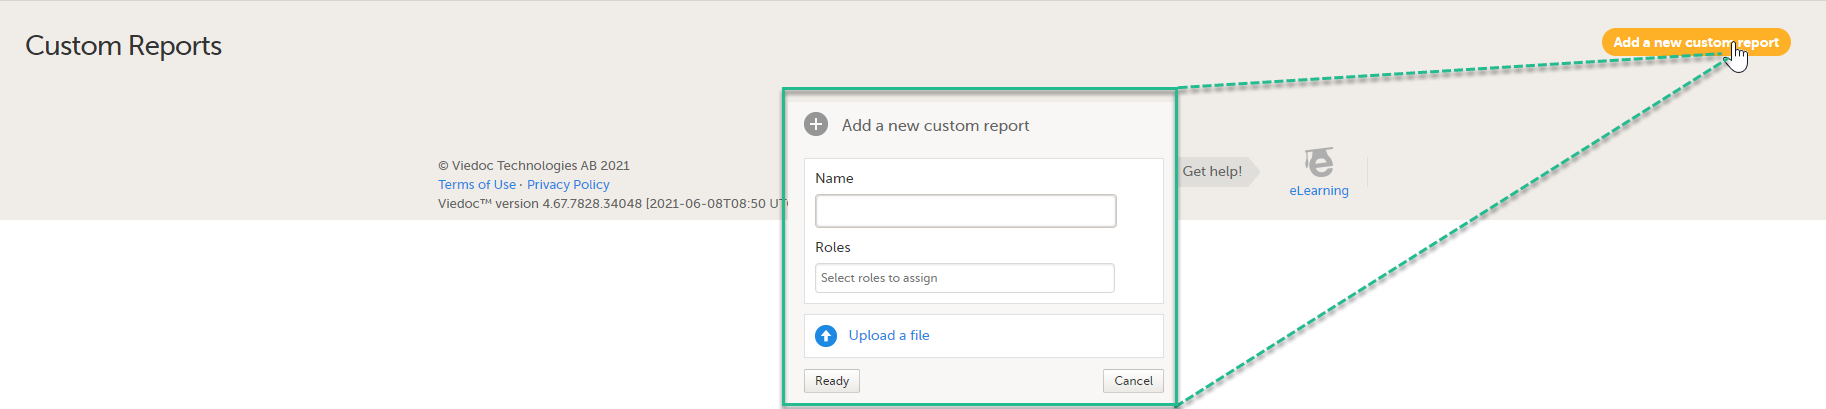
|
| 2 |
In the window that is displayed, enter a Name for the report. This name will be visible for the user in Viedoc Reports. Note! If you want to be able to download the report in XML format, the report name must contain the text string |
| 3 |
Click the Roles field and select the user roles in the dropdown list that should have access to the specific report. For a role to be visible here, ensure that:
|
| 4 | Select Production and/or Training mode. Only selecting training mode allows you to test your custom reports on demo data before using them on production data. You can edit the mode later at any time. |
| 5 |
Click Upload a file and select your R file. 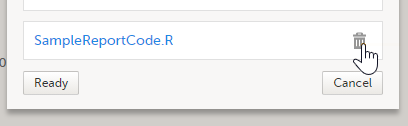
|
| 6 | When all settings are done, click Ready. |
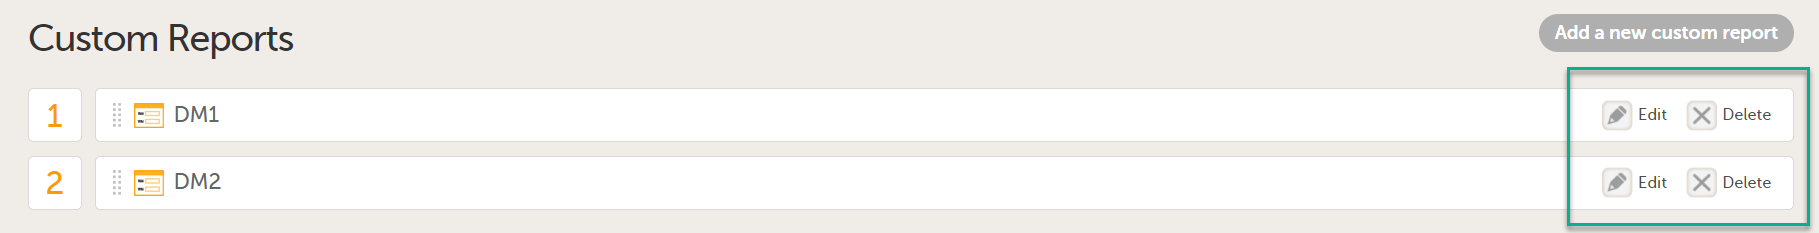
Saved custom reports can be edited or deleted from the main window. When editing an existing custom report definition you can change the name, change the roles that have access to the report, and/or upload a new version of the R file.
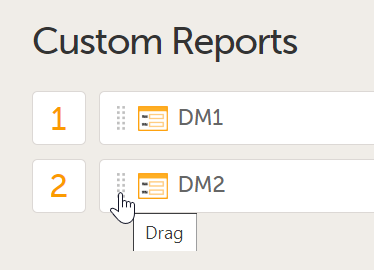
You can also change the order of how the reports will be shown in Viedoc Reports. Simply drag and drop the reports in the order of your choice and then click Save changes. The sequence numbers to the left reflect the order of how your custom reports appear for the end user of Viedoc Reports.
Note! After configuring Viedoc Reports, it must then be enabled in study settings in Viedoc Admin. For more information on setting up Viedoc Reports, see the Quick guide for setting up Viedoc Reports.