Demographics summary
Demographics summary
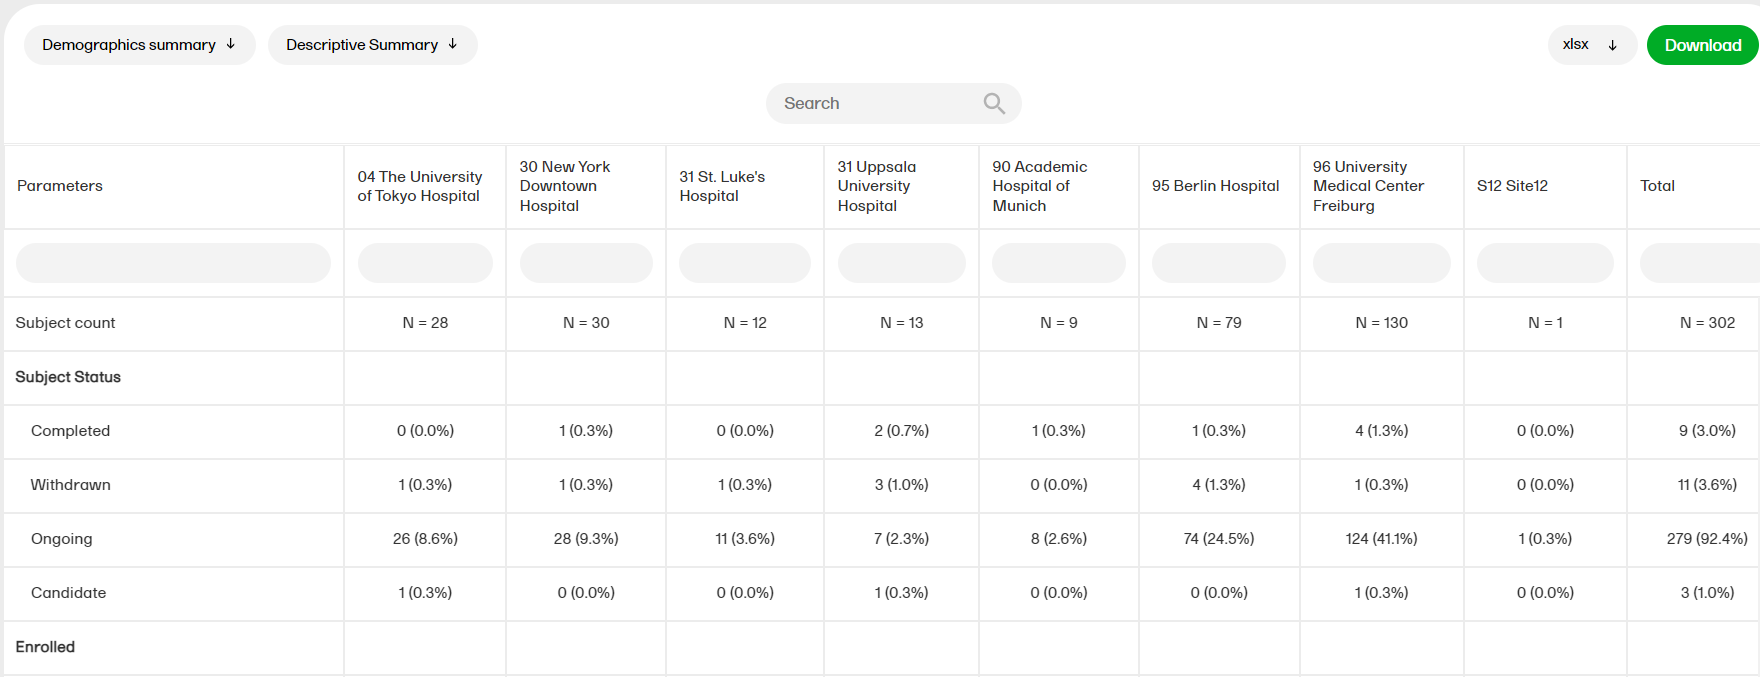
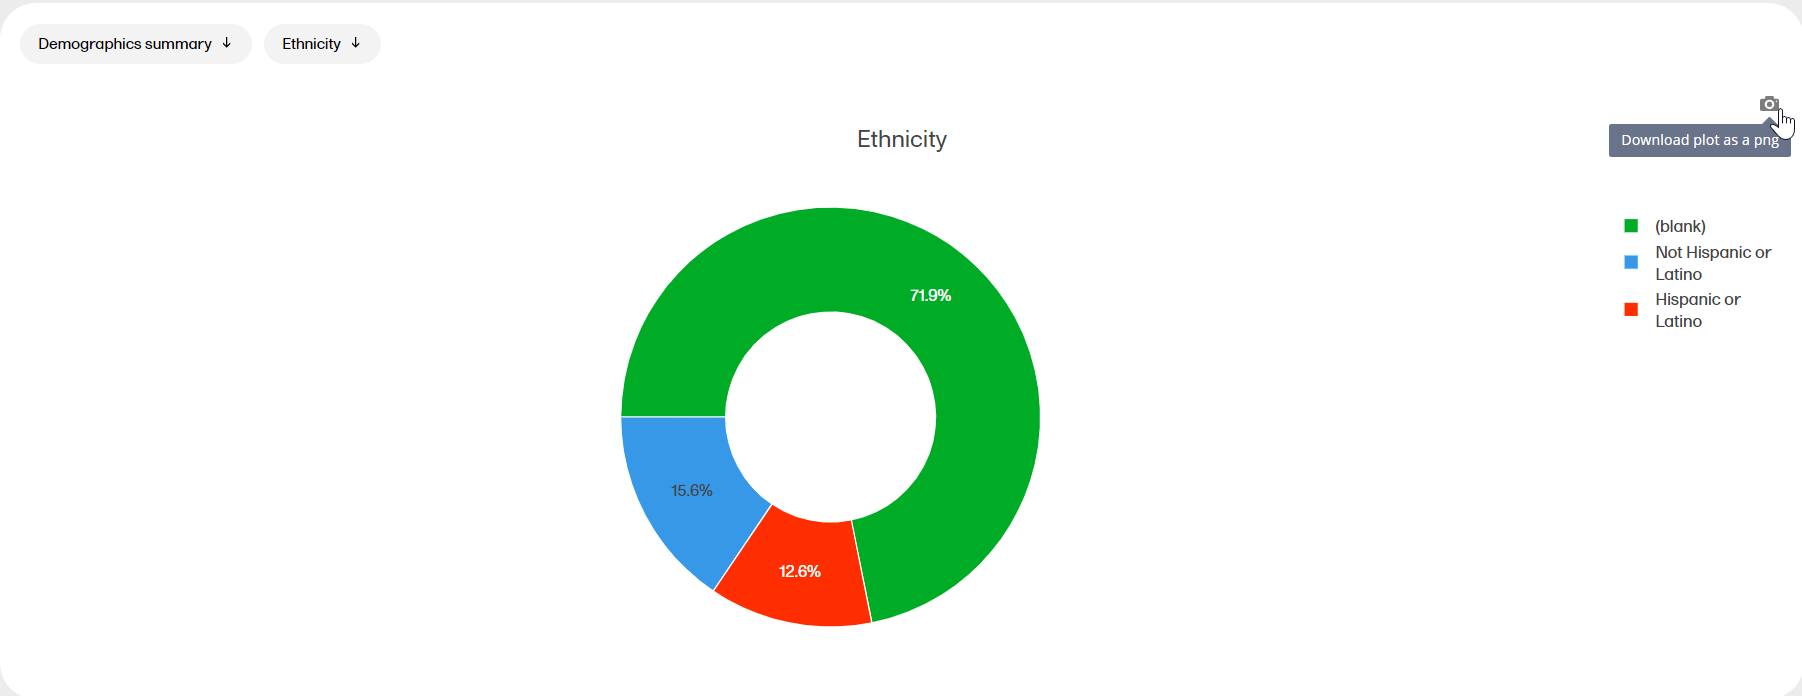
The Demographics summary report shows a table and a pie chart for the variables in the Demographics page.
(N = number of subjects)
The pie charts can be downloaded as a PNG file by clicking on the camera icon.
Subject count
| Description |
| The total number of subjects in a study and at a site/s. |
Subject status (Completed)
| Description |
| The number of subjects completed as defined in the study design. |
Subject status (Withdrawn)
| Description |
| The number of subjects withdrawn as defined in the study design. |
Subject status (Ongoing)
| Description |
| The number of subjects Screened and not Withdrawn and not Completed. |
Subject status (Candidate)
| Description |
| The number of subjects not Screened and not Completed and not Withdrawn |
Enrolled (Yes)
| Description |
| The number of EnrolledState 'Yes' selectees as defined in the study design. |
Enrolled (No)
| Description |
| The number of EnrolledState records that are 'false'. |