Adverse Events
Overview
The Adverse Events page provides metrics over the adverse events (AE) in the study. Here you can see up to six plots with distribution on different variables according to your study design. The last plot shows the number of AE per site.
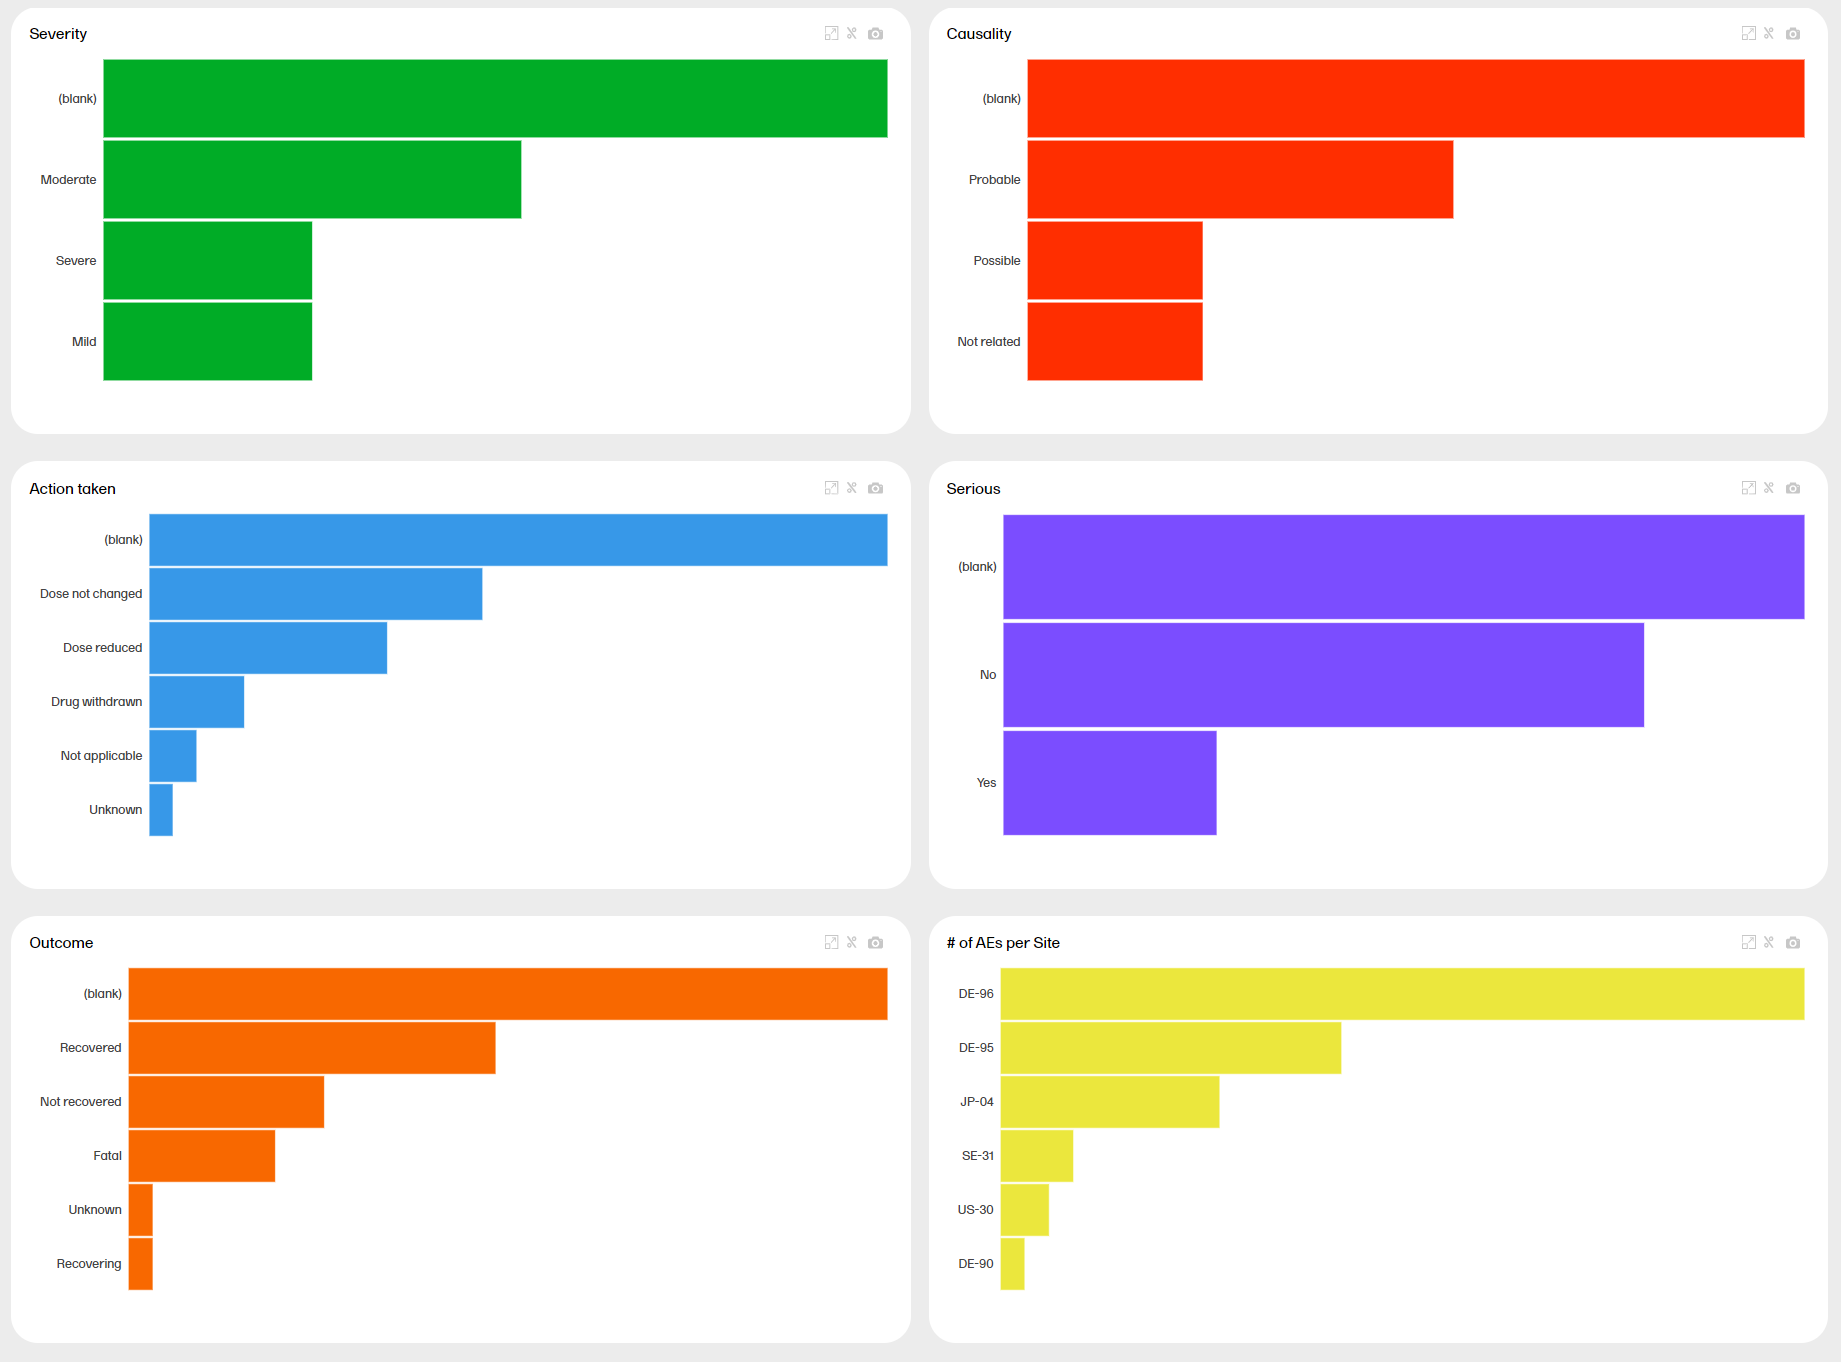
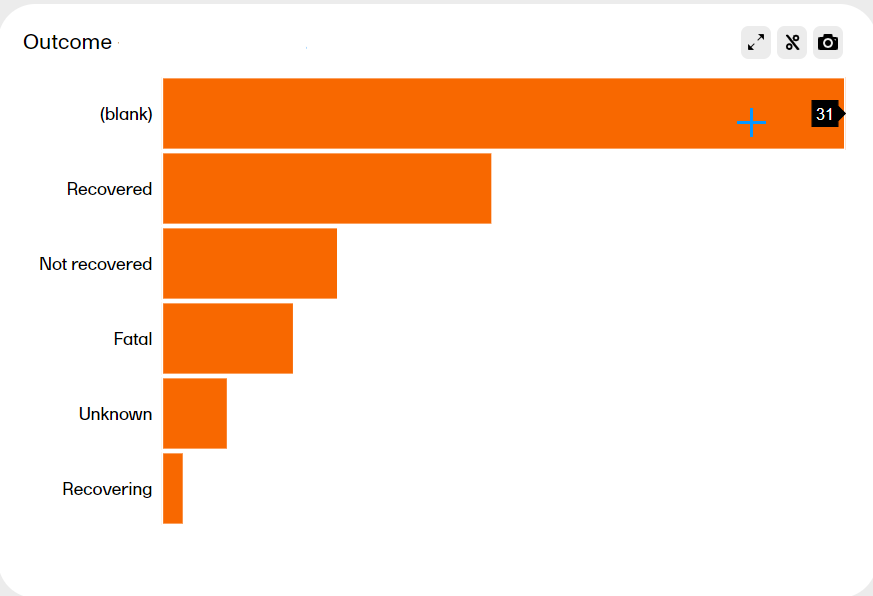
You can hover over a bar to see the exact value:
Tools
| Zoom | Press and drag at any given area to zoom it in. Double-click to zoom out. |
| Download | Click the  symbol to take a snapshot of the plot. A .png file will be downloaded to your computer. symbol to take a snapshot of the plot. A .png file will be downloaded to your computer. |
| Toggle | Click the  symbol to toggle the graph with 100% stacked bar. Click again to go back to the previous view. Toggling the bars shows the relationship between them, visualized on top of each other instead of side by side. symbol to toggle the graph with 100% stacked bar. Click again to go back to the previous view. Toggling the bars shows the relationship between them, visualized on top of each other instead of side by side. |
| Scale | Hover over the axis to make a double arrow appear. Then click and drag the arrows to scale the axis. |
| Expand | Click the  symbol to expand the plot into a new window and see more details. symbol to expand the plot into a new window and see more details.
 |
You can see more information about the tools here.
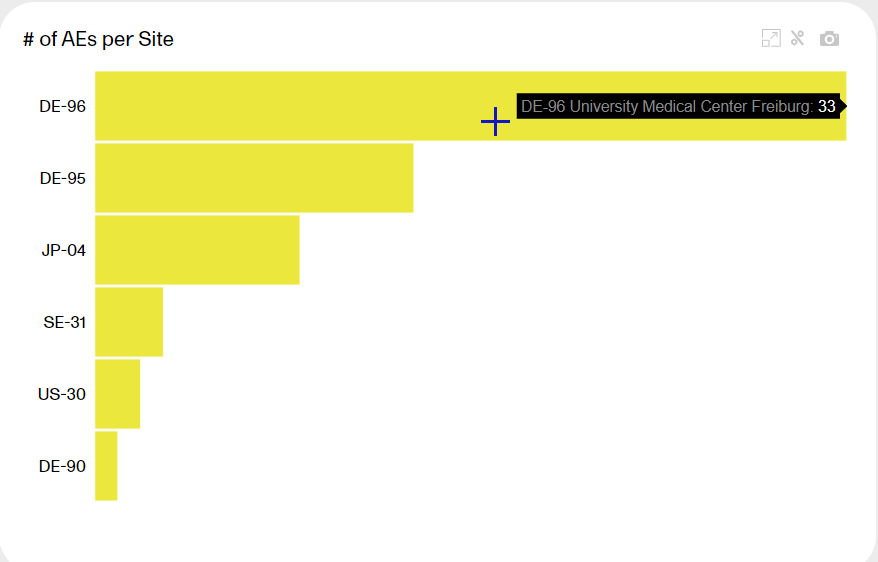
AE per site
The last plot shows the number of AE per site. Each bar reflects a site, identified with the site ID.
Hover over a bar to display the site ID, the site name, and the number of AE at the site.
Selecting a variable
You can click on one of the variables to arrange all other plots according to this variable. The variable must be non-numeric. Simply click on the plot you're interested in. For example, clicking the Serious plot arranges all plots by this variable:
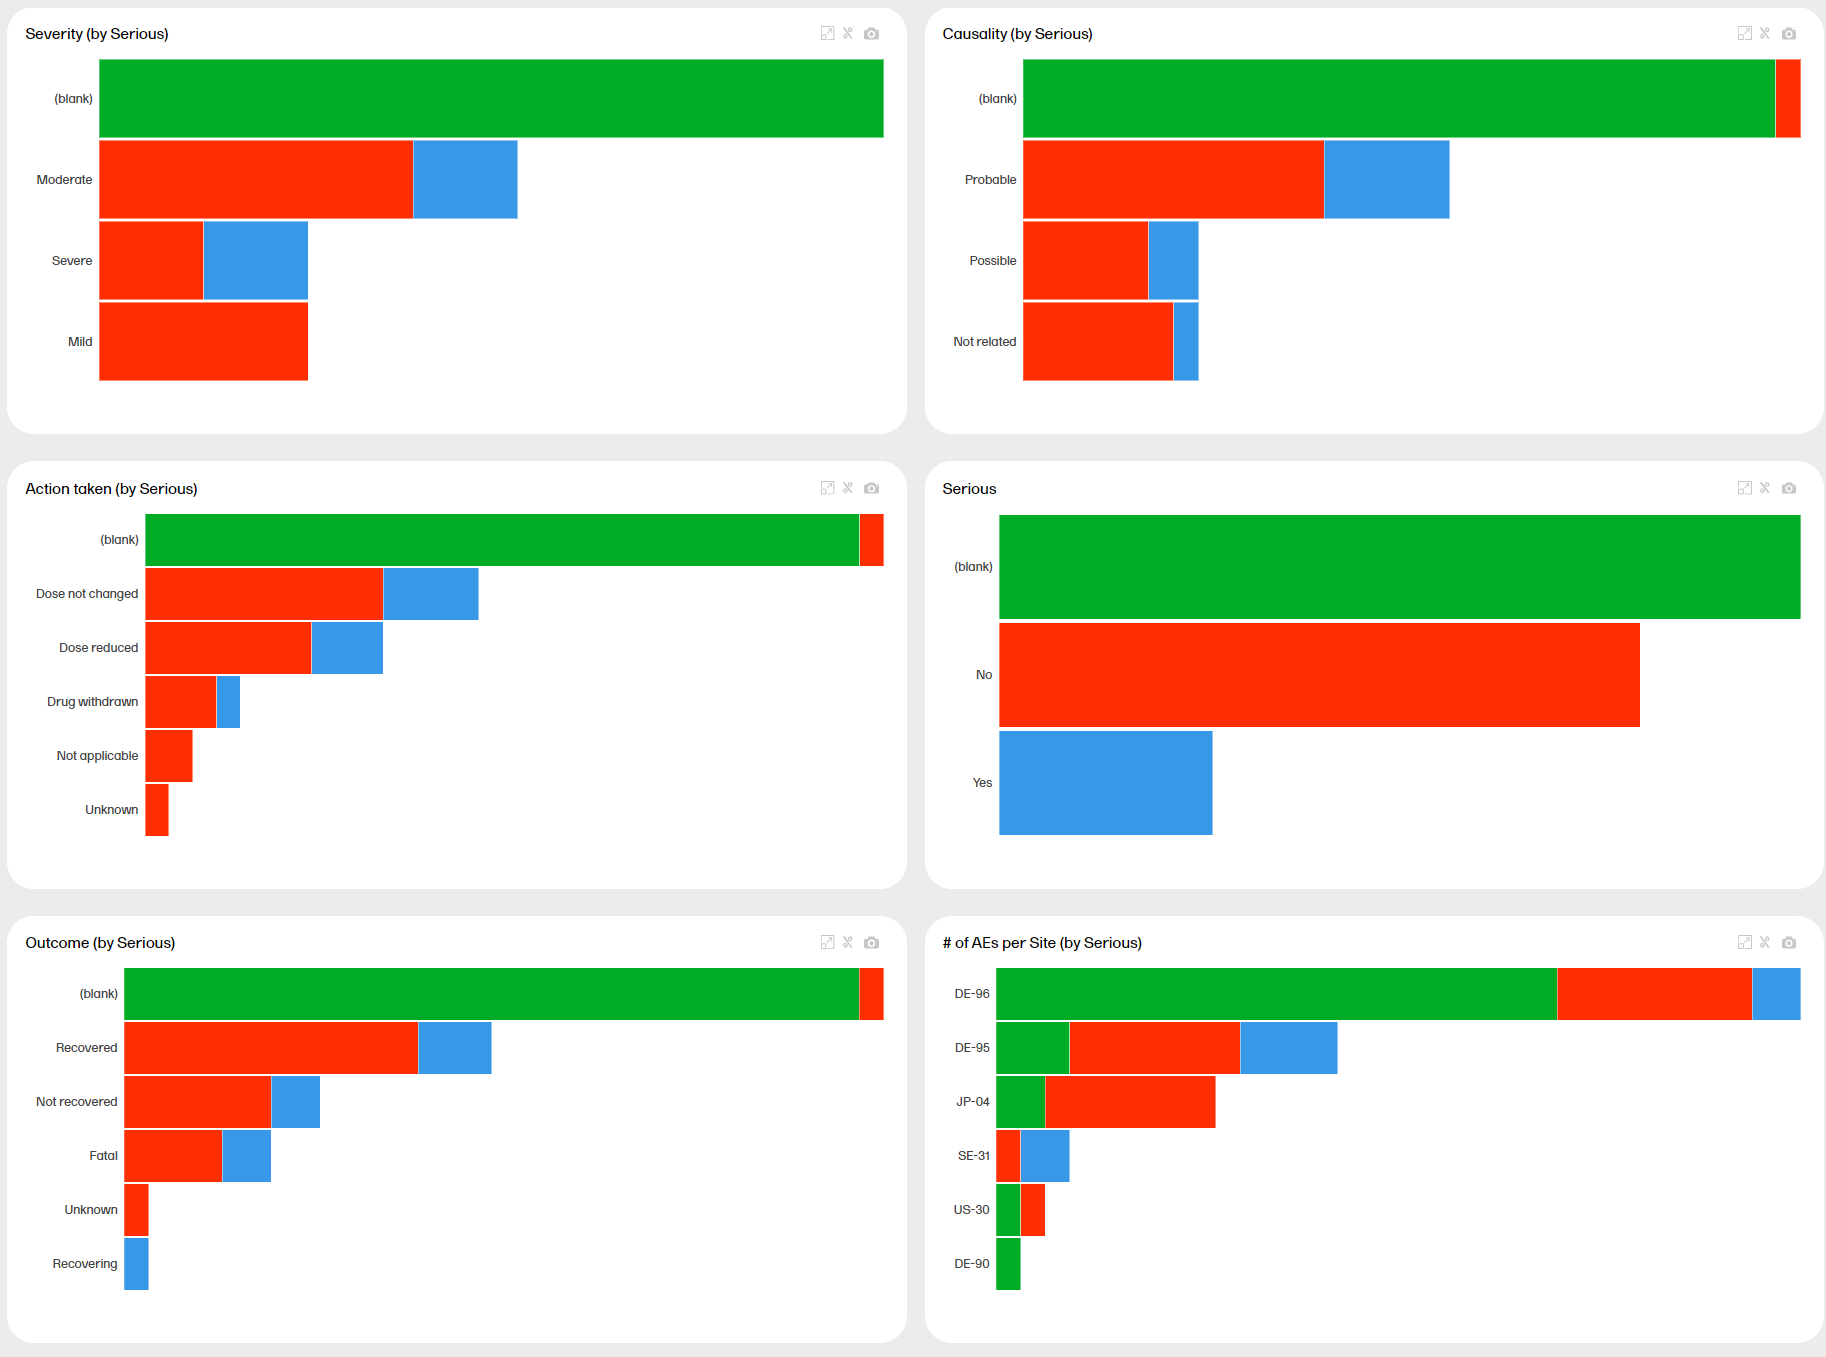
Note that all plot titles are renamed with the additional title (by Serious). Click again on the same plot to go back to the previous view, or click on another plot to arrange all other plots accordingly.