Viedoc Report: Audit Trail Review
Introduction
The Audit Trail Review (ATR) report shows divergences to the normal data entry pattern as well as the general performance.
ATR Sub reports
This report has two sub reports, Overview and Change over time that are described below.
Overview
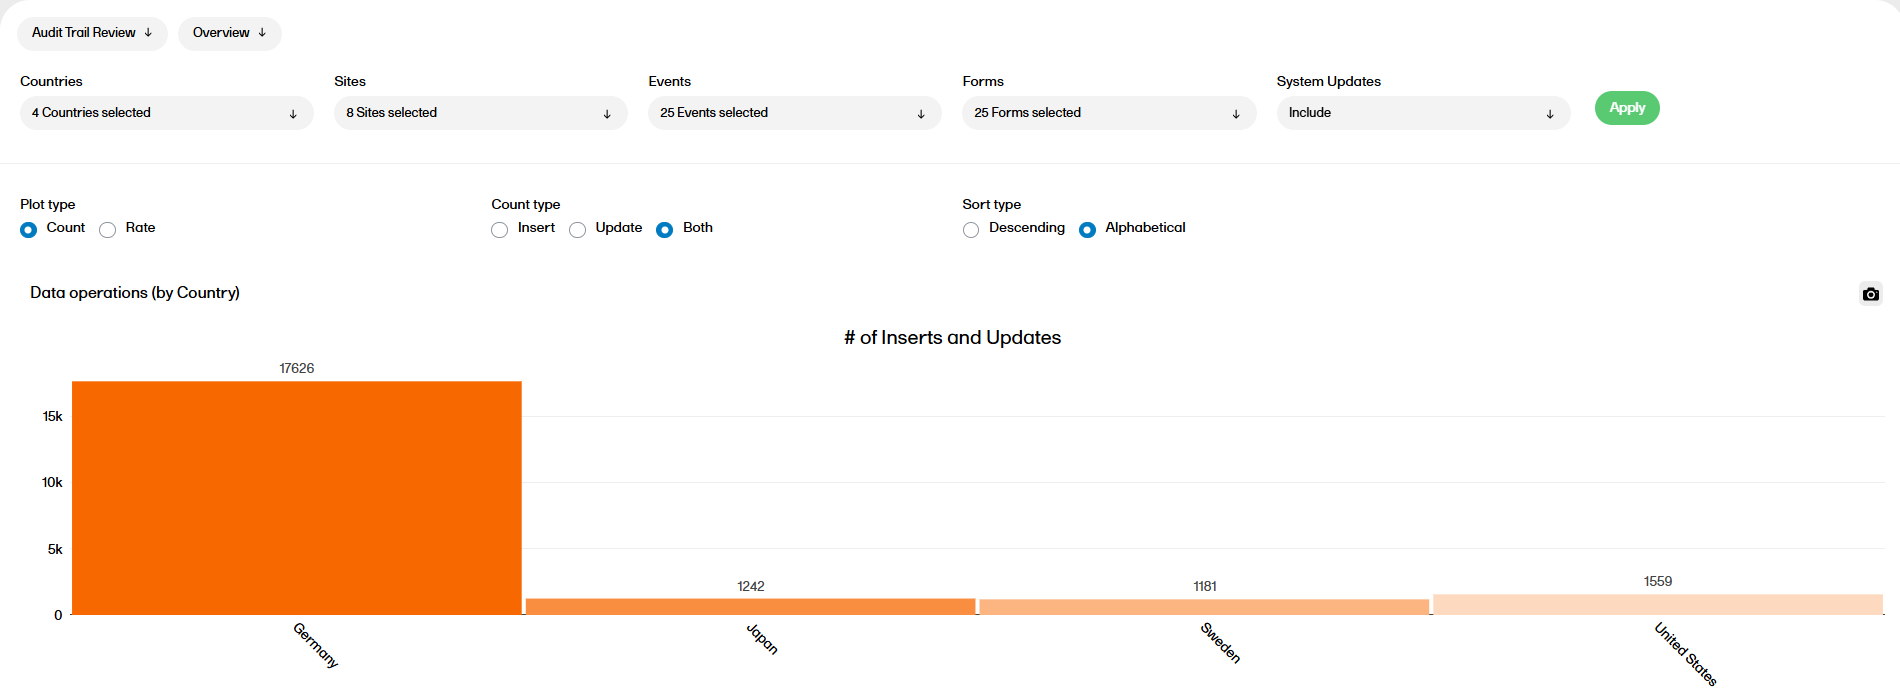
The following settings can be configured in the Overview sub report:
Filters:
- Filter the report by Countries, Sites, Events, or Forms (all options are selected by default).
- Include or Exclude (default) system updates.
- Select Apply to save the filters.
Plot type and Rate type:
- If Plot type Count is selected, the number of data operations is shown in each bar. You can switch between showing only the Inserts, Updates, or Both using the Count type radio control.
- If Plot type Rate and Rate type Subject are selected, then
- by Country/by Site plots display Updates per Subject
- by Event plot displays Updates per Subject Event
- by Form plot displays Updates per Subject Form
- If Plot type Rate and Rate type Item are selected, then the all the plots display Updates per Item.
Sort type:
- Select the Sort type (Descending/Alphabetical) to sort the bars either based on the descending order of the bar height, or by alphabetical order of the x-axis labels.
You can now see the data operations by country, site, event, and form. You can also see the data operations by item (top 20), which only appears if plot type Count is selected.
Terms
Insert: For the grouping Subject, Event, Activity, Form, Item the first entry is called 'Insert'.
Update: For the same grouping the other entries are called 'Update'.
System Updates: Records that are of OperationType 'Update' and the EditBy is 'System(0)' are considered as System Updates
Rate by Item is number of Updates/ number of Inserts (per item, subject event, etc. based on plot viewing) rounded to the 2nd decimal.
Rate by Subject is number of Updates (per item, subject, event, etc. based on plot viewing)/ count of Subjects rounded to the 2nd decimal.
Overview and Plot terms
Rate by Item: The Line value is calculated as sum of number of Updates / sum of number of Inserts at a study level rounded to the 2nd decimal.
Rate by Subject : The line value is calculated as sum of number of Updates/ count of total subjects in the study rounded to the 2nd decimal.
Change over time
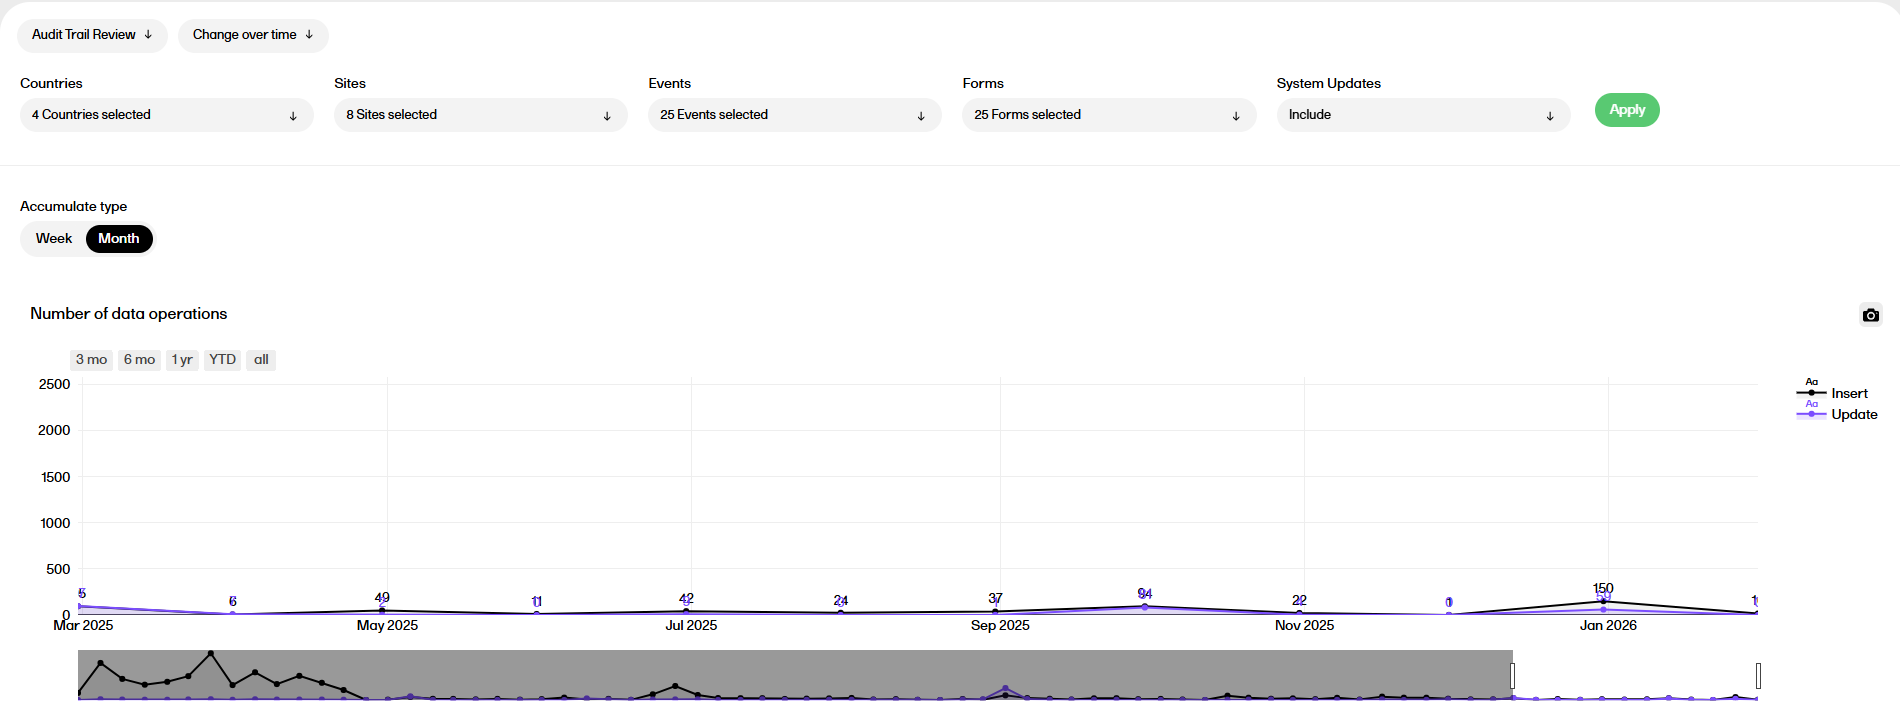
The following settings can be configured in the Change over time sub report:
Filters:
- Filter the report by Countries, Sites, Events, or Forms (all options are selected by default).
- Include or Exclude (default) system updates.
- Select Apply to save the filters.
Accumulate type:
- Accumulate type can be used to define the timepoints interval at which the data should be accumulated in the below two plots.
Change over time plots
There are two plots in the Change over time sub report, Number of data operations and Cumulative number of data operations. Both plots are described below.
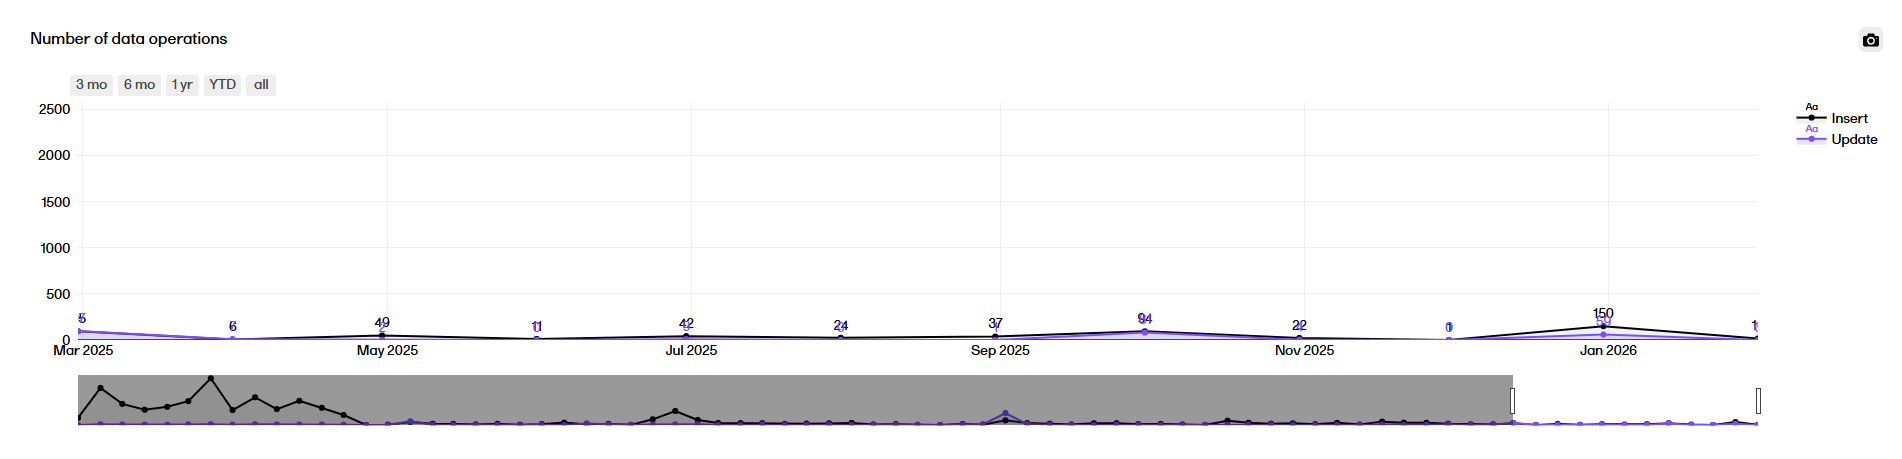
Features common to both plots:
- A smaller plot is provided below the main plot which be used to zoom and pan the main plot.
- By default, the plots are zoomed to the last 12 timepoints.
- You can use the buttons at the top of the plot to zoom to different time period windows (for example 3 months or year-to-date (YTD), etc.).
Number of data operations plot
The Number of data operations plot displays a timeline across the study start until now, rendering the number of Inserts/Updates accumulated between each time point.
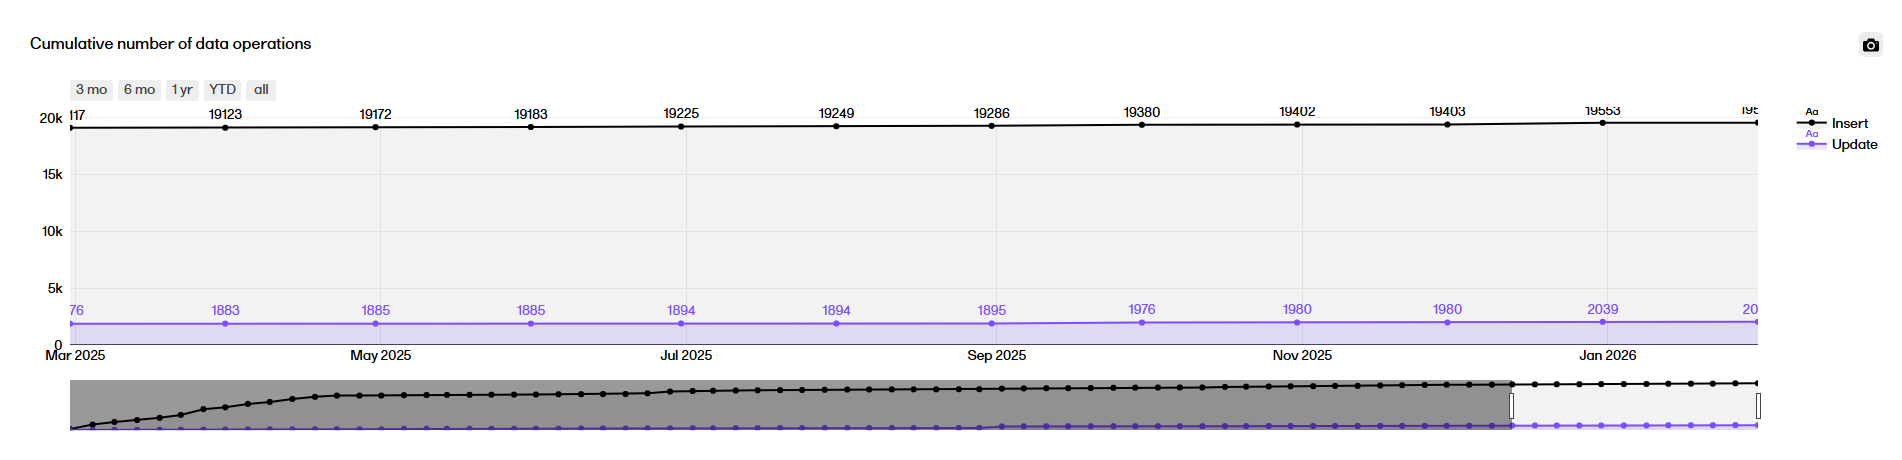
 Cumulative number of data operations
The Cumulative number of data operations plot displays a timeline across the study start until now, rendering the cumulative number of Inserts or Updates done since the start of study up until that time point.