Viedoc Reports: Key Risk Indicators
Introduction
The Key risk indicator (KRI) report gives you a quick overview of the key risk indicators per site. This report has three sub reports: Overview, by Site, and by Key risk indicator.
KRI calculations
The KRI values are based on calculations of:
- Site value
- Study mean (from Site value)
- Study deviation (from Site value)
Note! UTC is the standard in all calculations using date and time.
The following KRI values can be shown in the reports:
eCRF Data entry lag
Fetches the timelapse days for each form.
The Site value is the average number of timelapses across all forms in a site.
Note! The logic for the eCRF data entry lag calculation is as below:
- For each form, the difference between the form Initiated Date and the corresponding Event Date is calculated. This is considered as the lapsed time in days from the date of the visit to the date of form initiation.
- For example, if the Event Date is 01-Feb-2022, but the form was first saved on 10-Feb-2022, the timelapse would be 9 days.
- This information is also available as part of another standard report: Data Entry Cycle Time (by Form subreport - the last column is the Data Entry Cycle Time (days).
Overdue events per subject
Calculates the average number of overdue events for each subject.
The Site value is the average number of overdue events per subject for each site.
Overdue events is not shown if there are no overdue events in the study.
Pending forms per subject
Calculates the average number of pending forms for each subject.
The site value is the average number of pending forms per subject for each site.
Pending forms is not shown if there are no pending forms in the study.
Data changes per form
Fetches the number of updates for each form.
The Site value is the average number of updates across all forms in a site.
Note! System updates for the Data changes per form are not considered. Also, we only consider the updates but not the initial entry for the calculation.
Signature lag (in days)
Calculates the signature lag (in days) for each form. This is calculated as the number of days between the last edit date and time and signature date and time.
This is calculated only when there are signed forms in the study.
Note! The signature lag is calculated as below:
- Site average = average of signature lag across all forms in each site.
- Study average (from site level data).
- Study standard deviation (from site level data).
- Study median (from site level data).
AE - # of AE for each subject
This is calculated only if the AE module is defined.
Calculates the number of AE for each patient (one record per patient, with frequency of AE).
The Site value is the average number of AEs across all subjects in a site.
DOR% (drop out rate)
Calculates the drop out rate.
The Site value is the number of dropout subjects multiplied with 100 divided with the number of enrolled subjects.
For more information about the DOR% select this link.
SFR% (screening failure rate)
Calculates the screening failure rate.
The Site value is the number of screen failed subjects multiplied with 100 divided with the number of screened subjects.
Note! The screen failure rate is based on the following subject status definition in Viedoc Designer: ScreenFailed - if WithdrawnState = TRUE and EnrolledState != TRUE
Open Queries per subject
Calculates the number of queries for each subject.
The Site value is the average number of open queries across all subjects in a site (missing data and pre-queries are excluded).
Processed Queries per subject
Calculated as # resolved, closed, rejected or approved queries / # of Subjects
The Site value is the average number of resolved, closed, rejected or approved queries across all subjects in a site (missing data, pre-queries, and removed queries are excluded).
Rejected queries per subject
Calculates the number of rejected queries for each subject.
The Site value is the average number of queries with query status as rejected per subject for each site (pre-queries are excluded).
Rejected queries is not shown if there are no rejected queries in the study.
Time to query resolution (in days)
Calculated as sum of 'Open to Resolved Days'* or if missing, 'Open to Closed Days'*/'#Closed queries' (pre-queries and Removed queries are excluded).
The Site value is the average number of days is took between query raised day to query closed day across all queries in a site.
Confirmed missing per subject
Calculated as '#Confirmed missing items'* / '# of Subjects'
The Site value is the average number of confirmed missing data across all subjects in a site.
Unconfirmed missing per subject
The same as "Open Queries per subject" (but only for Unconfirmed missing).
The Site value is the average number of unconfirmed missing data across all subjects in a site.
The Study mean and Study deviation is the average and standard deviation of the Site value across all sites.
KRI sub reports
The Key Risk Indicators report has three sub reports, Overview, by site, and by Key Risk Indicator, which are described below.
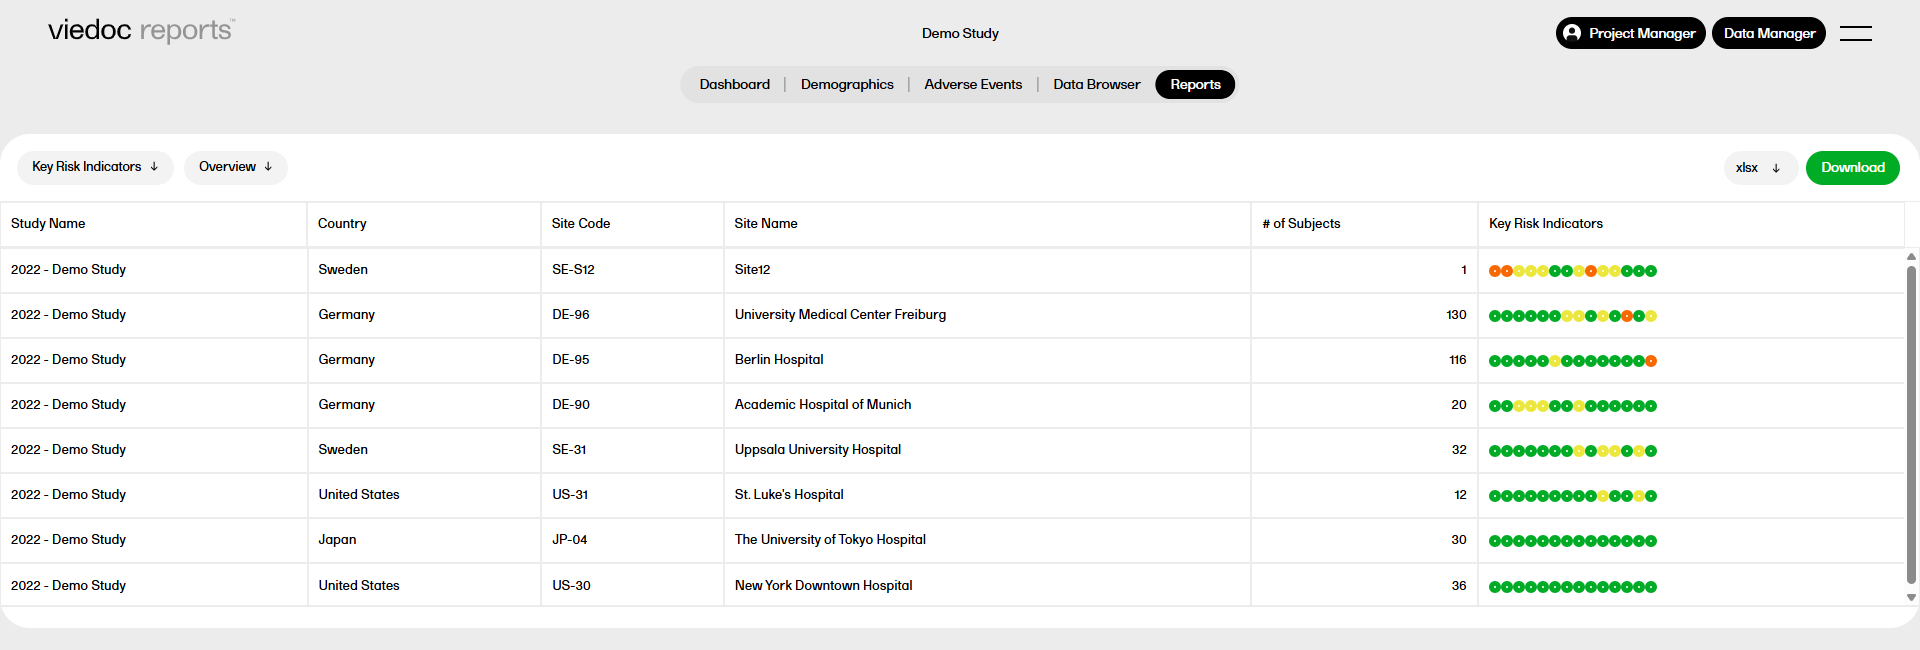
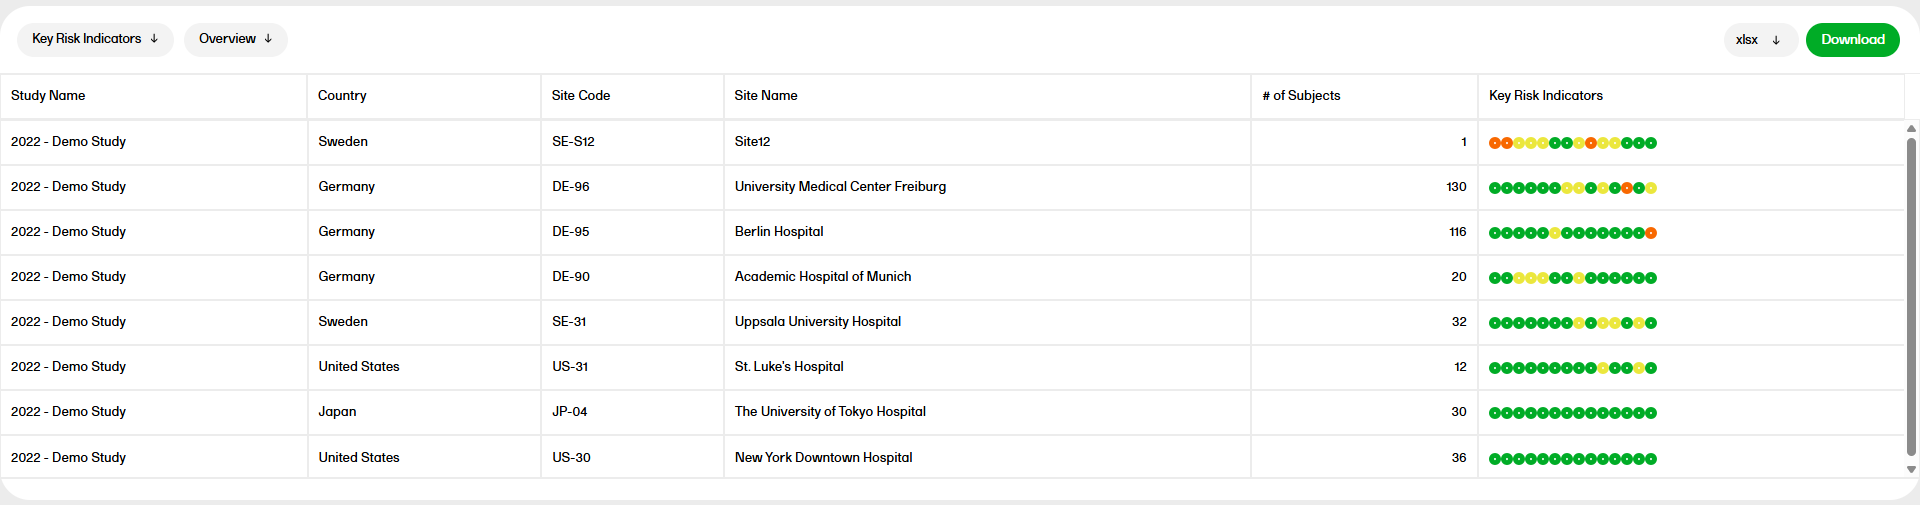
Overview
The Overview sub report shows a table with one record per site, with the columns Study Name, Country, Site Code, Site Name, # of subjects, and Key Risk Indicators. The circles represent the KRI with severity going from green to yellow to red. You can hover over each circle to see the KRI.
by Site
In the by Site sub report, you can select a site to see a pie chart with the KRI status for that site. Below the chart you can also see a table with more details about the KRI, showing the Study Name, Country, Site Code, Site Name, Key Risk Indicator, Site Value, Study Mean, Study Deviation, and Thresholds.
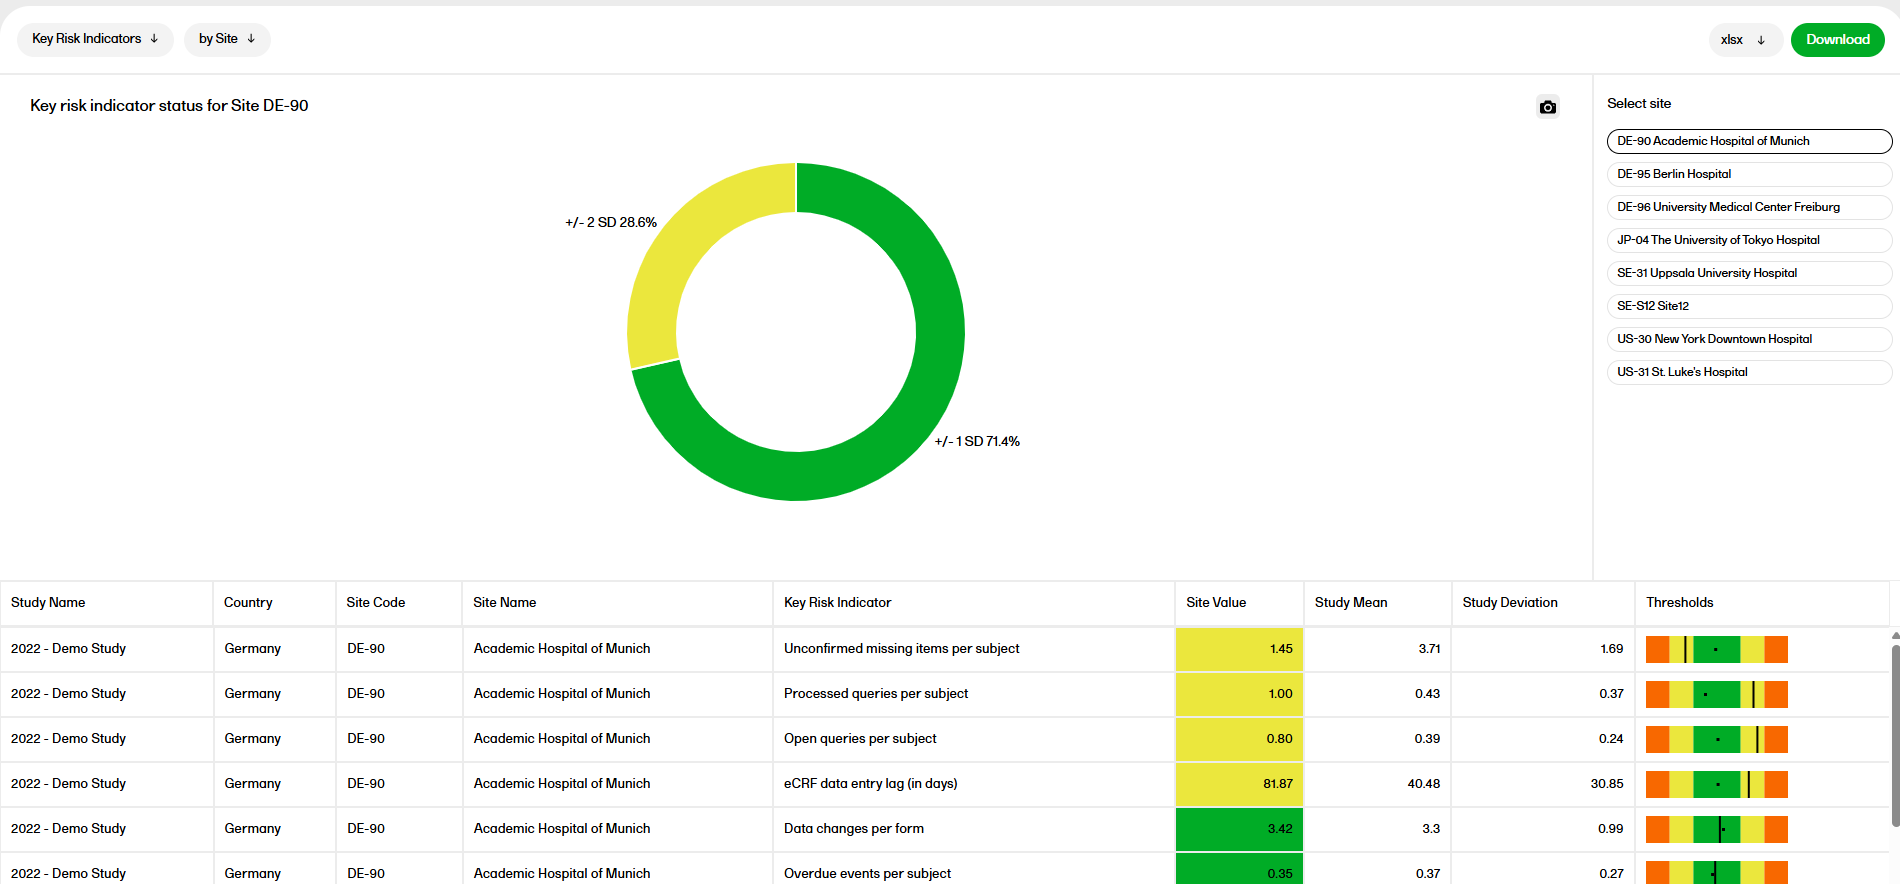
Metrics:
- Site Value - the calculated value of that particular indicator for that particular site
- Study Mean - the mean of the site values for that particular indicator
- Study Deviation - the standard deviation of the site values for that particular indicator
- Thresholds - the median of the site values (as a dot), site value (as a line) and the +/- 1-SD (as green), +/- 2-SDs (yellow), +/- 3-SDs (as red) as color bands.
SD = Standard deviation
by Key risk indicator
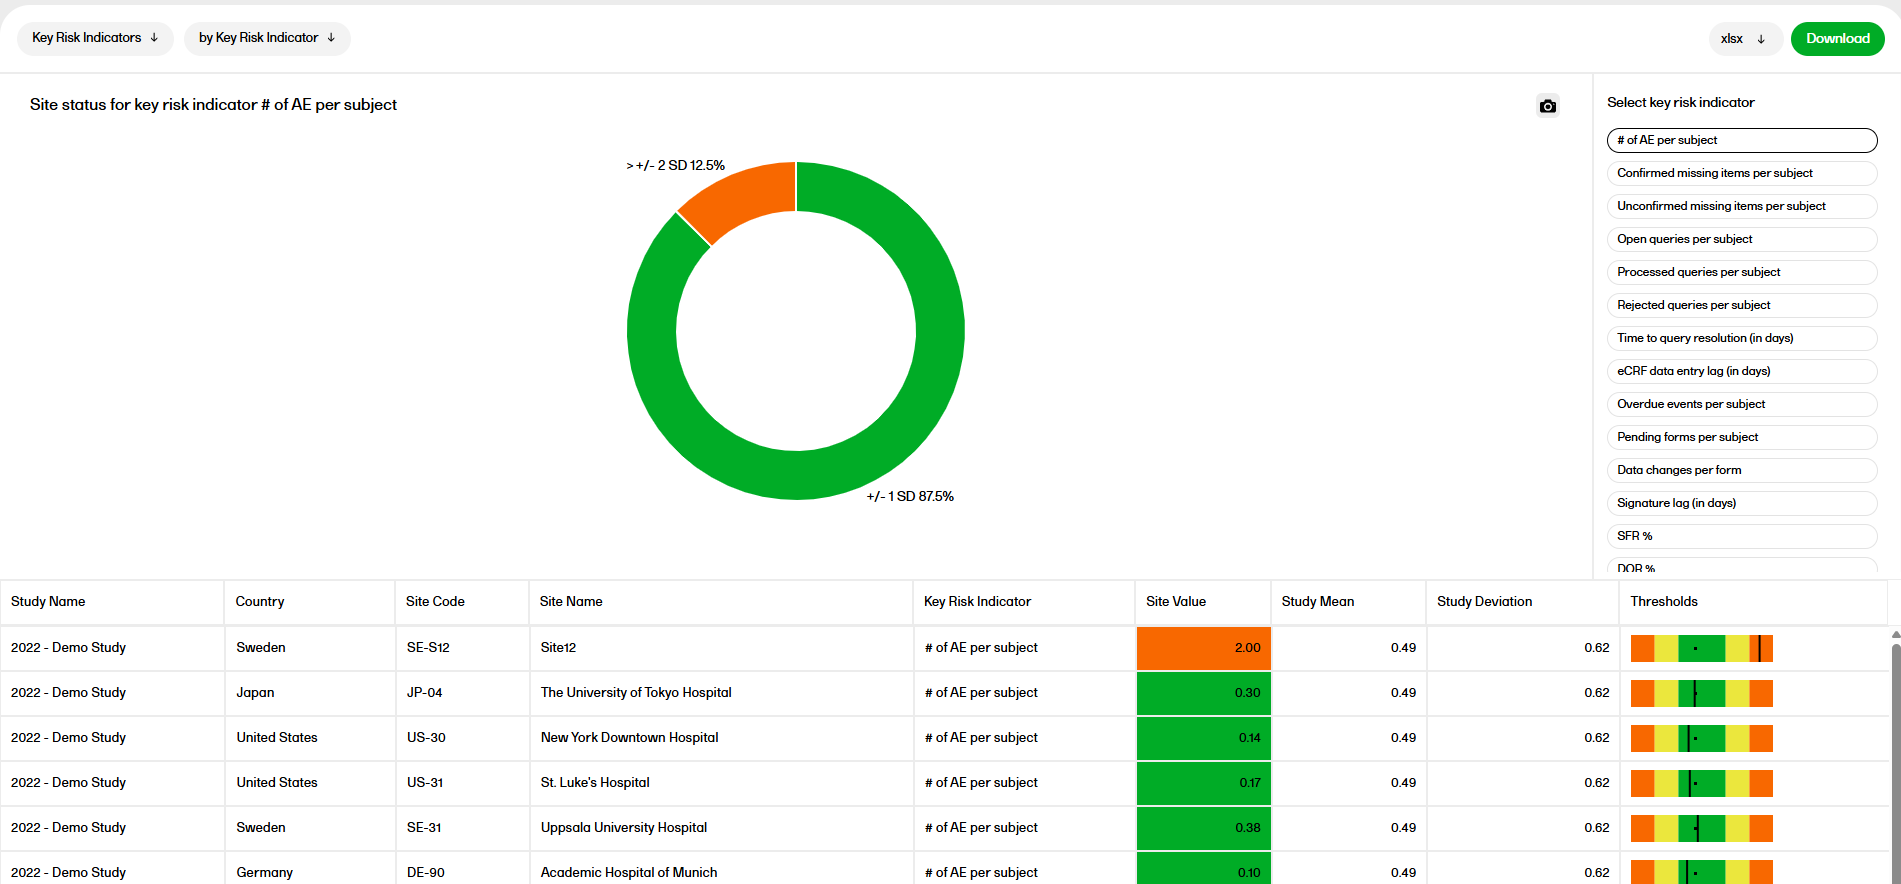
Metrics:
- Site Value - the calculated value of that particular indicator for that particular site
- Study Mean - the mean of the site values for that particular indicator
- Study Deviation - the standard deviation of the site values for that particular indicator
- Thresholds - the median of the site values (as a dot), site value (as a line) and the +/- 1-SD (as green), +/- 2-SDs (yellow), +/- 3-SDs (as red) as color bands.
SD = Standard deviation